Wix Results Presentation Deck
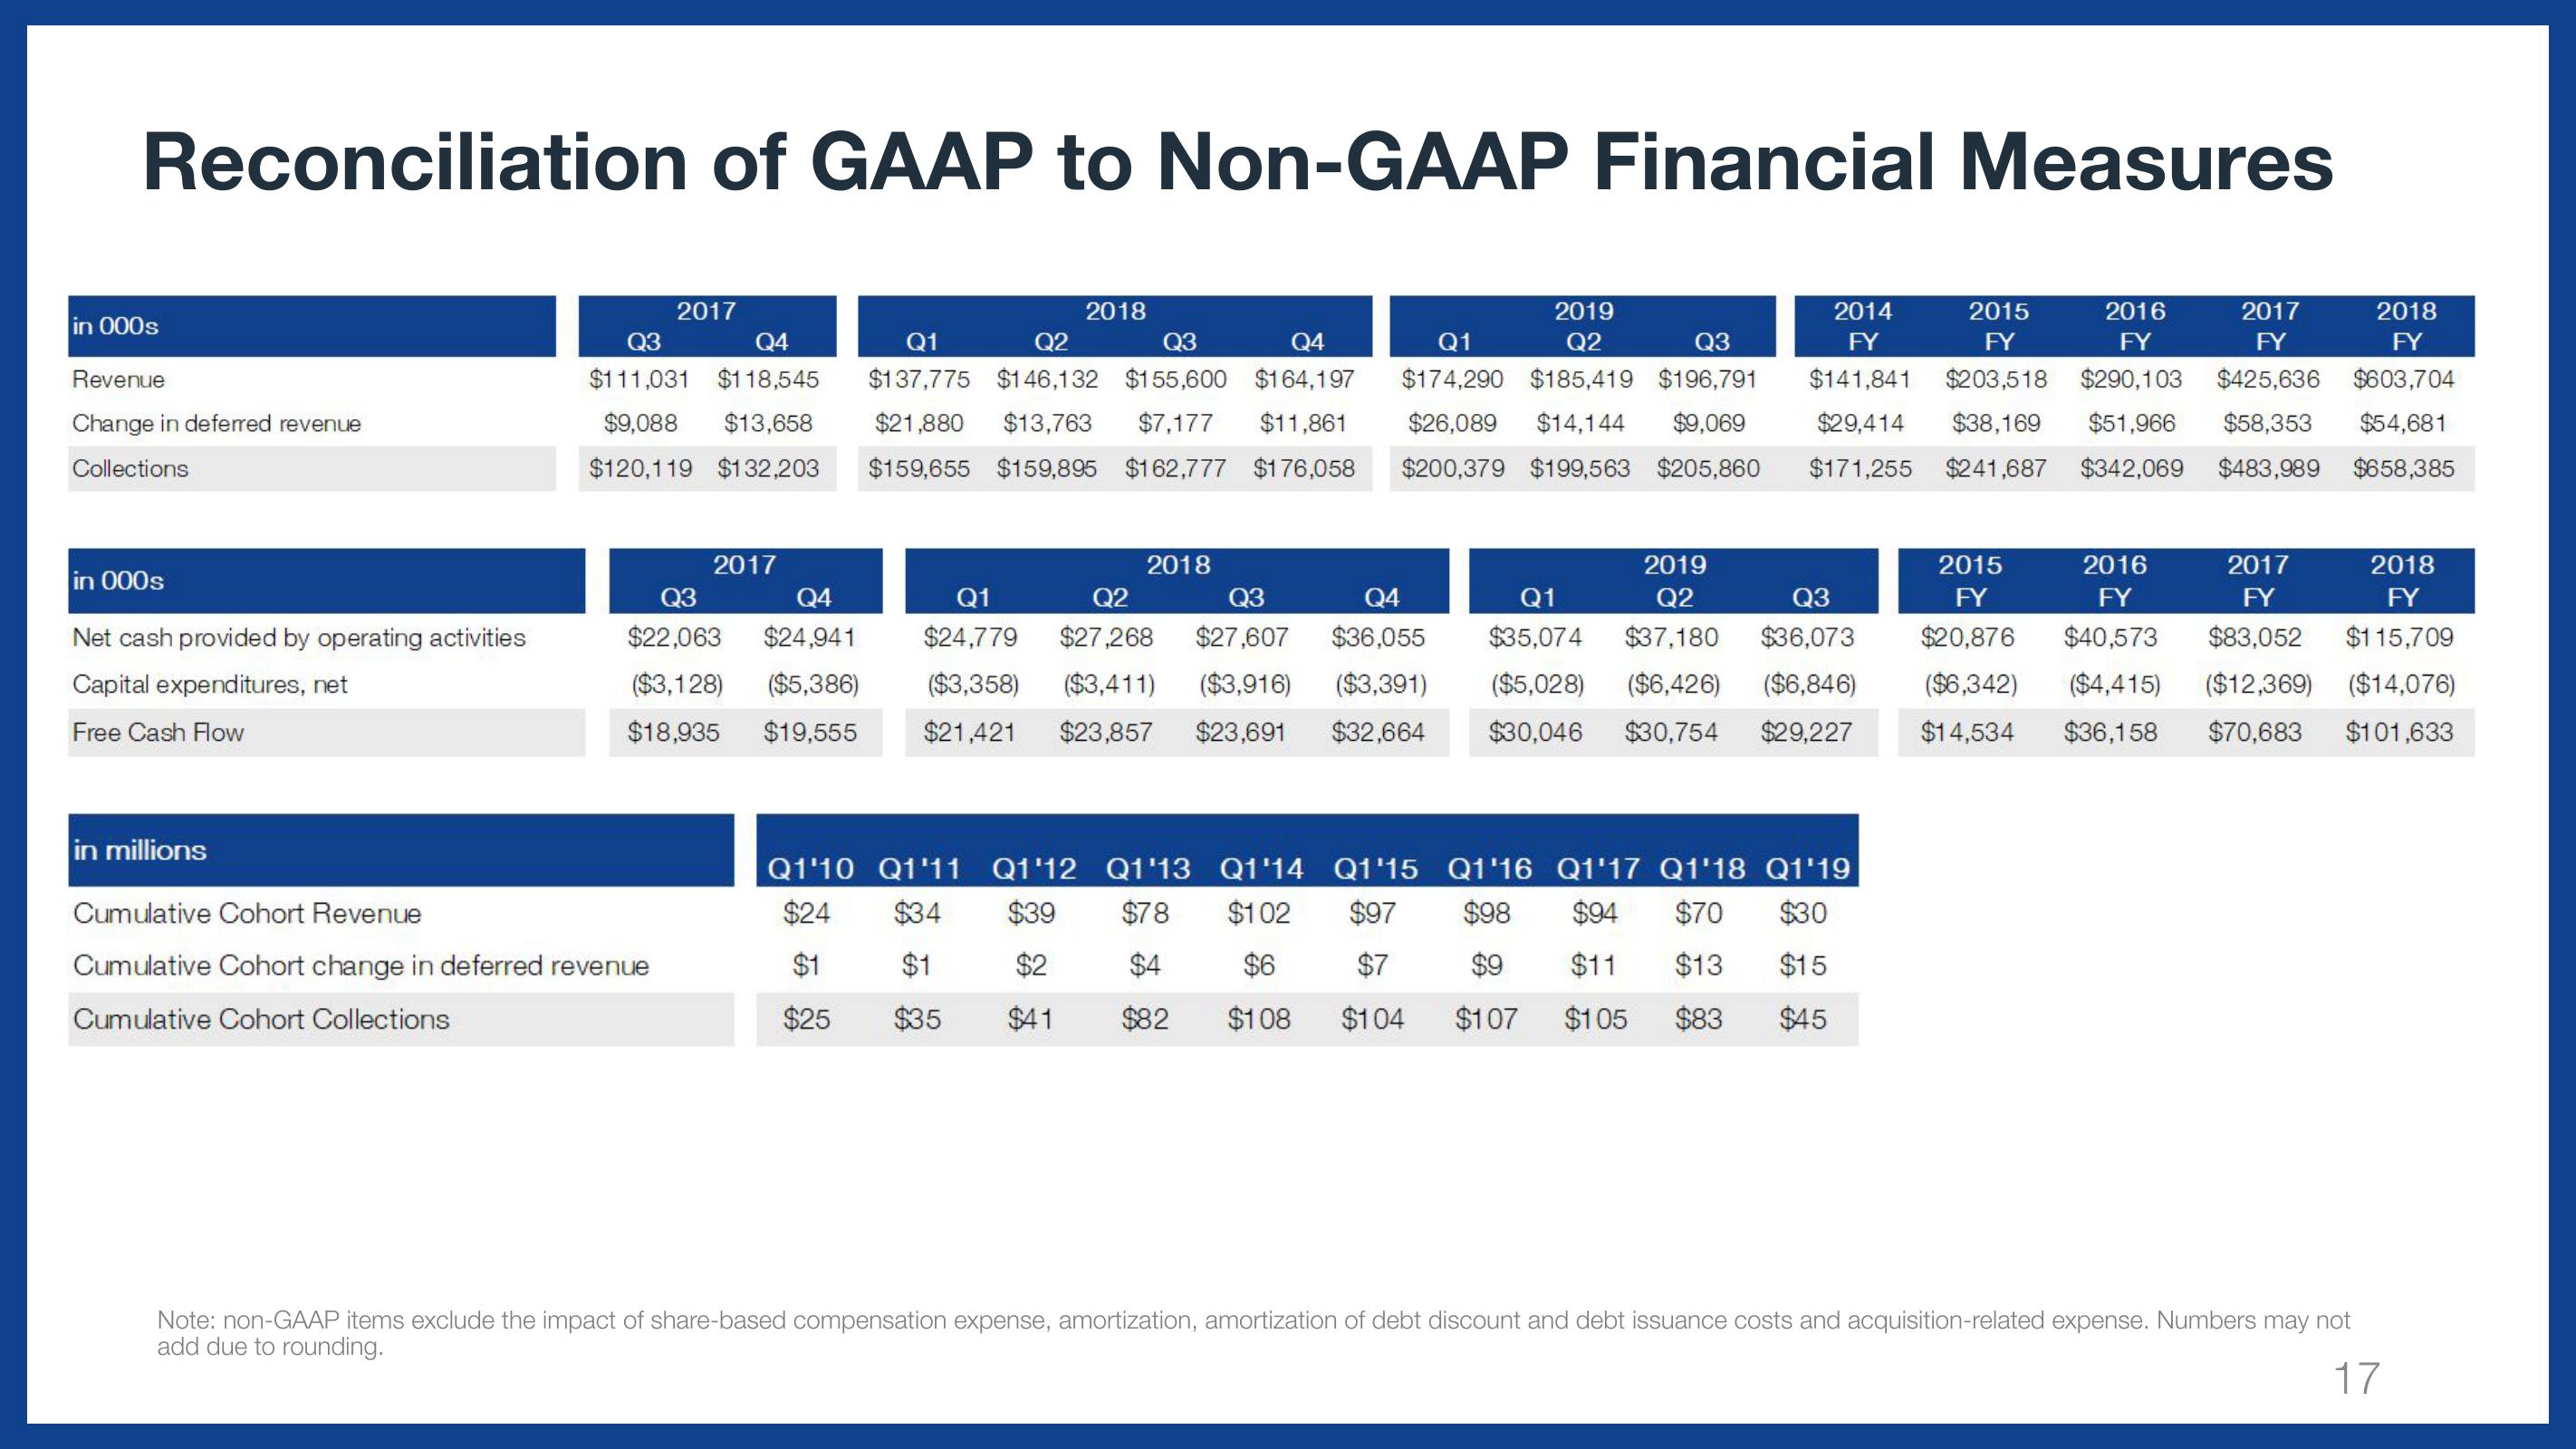
Reconciliation of GAAP to Non-GAAP Financial Measures
in 000s
Revenue
Change in deferred revenue
Collections
in 000s
Net cash provided by operating activities
Capital expenditures, net
Free Cash Flow
2017
Q4
Q3
$111,031 $118,545
$9,088 $13,658
$120,119 $132,203
in millions
Cumulative Cohort Revenue
Cumulative Cohort change in deferred revenue
Cumulative Cohort Collections
2017
Q3
Q4
$22,063 $24,941
($3,128) ($5,386)
$18,935 $19,555
2018
Q1
Q4
Q2
Q3
$137,775 $146,132 $155,600 $164,197
$21,880 $13,763 $7,177 $11,861
$159,655 $159,895 $162,777 $176,058
2018
2019
Q3
Q1
Q2
$174,290 $185,419 $196,791
$26,089 $14,144 $9,069
$200,379 $199,563 $205,860
Q1
Q2
Q3
Q4
$24,779 $27,268 $27,607 $36,055
($3,358) ($3,411) ($3,916) ($3,391)
$21,421 $23,857 $23,691 $32,664
2014
2015
2016
2017
2018
FY
FY
FY
FY
FY
$141,841 $203,518 $290,103 $425,636 $603,704
$29,414 $38,169 $51,966 $58,353 $54,681
$171,255 $241,687 $342,069 $483,989 $658,385
2019
Q1
Q2
Q3
$35,074 $37,180 $36,073
($5,028) ($6,426) ($6,846)
$30,046 $30,754 $29,227
Q1'10 Q1'11 Q1'12 Q1'13 Q1'14 Q1'15 Q1'16 Q1'17 Q1'18 Q1'19
$24 $34 $39 $78 $102 $97
$98 $94 $70 $30
$1 $1 $2 $4 $6 $7 $9
$11 $13 $15
$25 $35 $41 $82 $108 $104 $107 $105 $83 $45
2016
2017
2018
FY
FY
FY
$40,573 $83,052 $115,709
2015
FY
$20,876
($6,342) ($4,415) ($12,369) ($14,076)
$14,534 $36,158 $70,683 $101,633
Note: non-GAAP items exclude the impact of share-based compensation expense, amortization, amortization of debt discount and debt issuance costs and acquisition-related expense. Numbers may not
add due to rounding.
17View entire presentation