SmileDirectClub Results Presentation Deck
Marketing & selling.
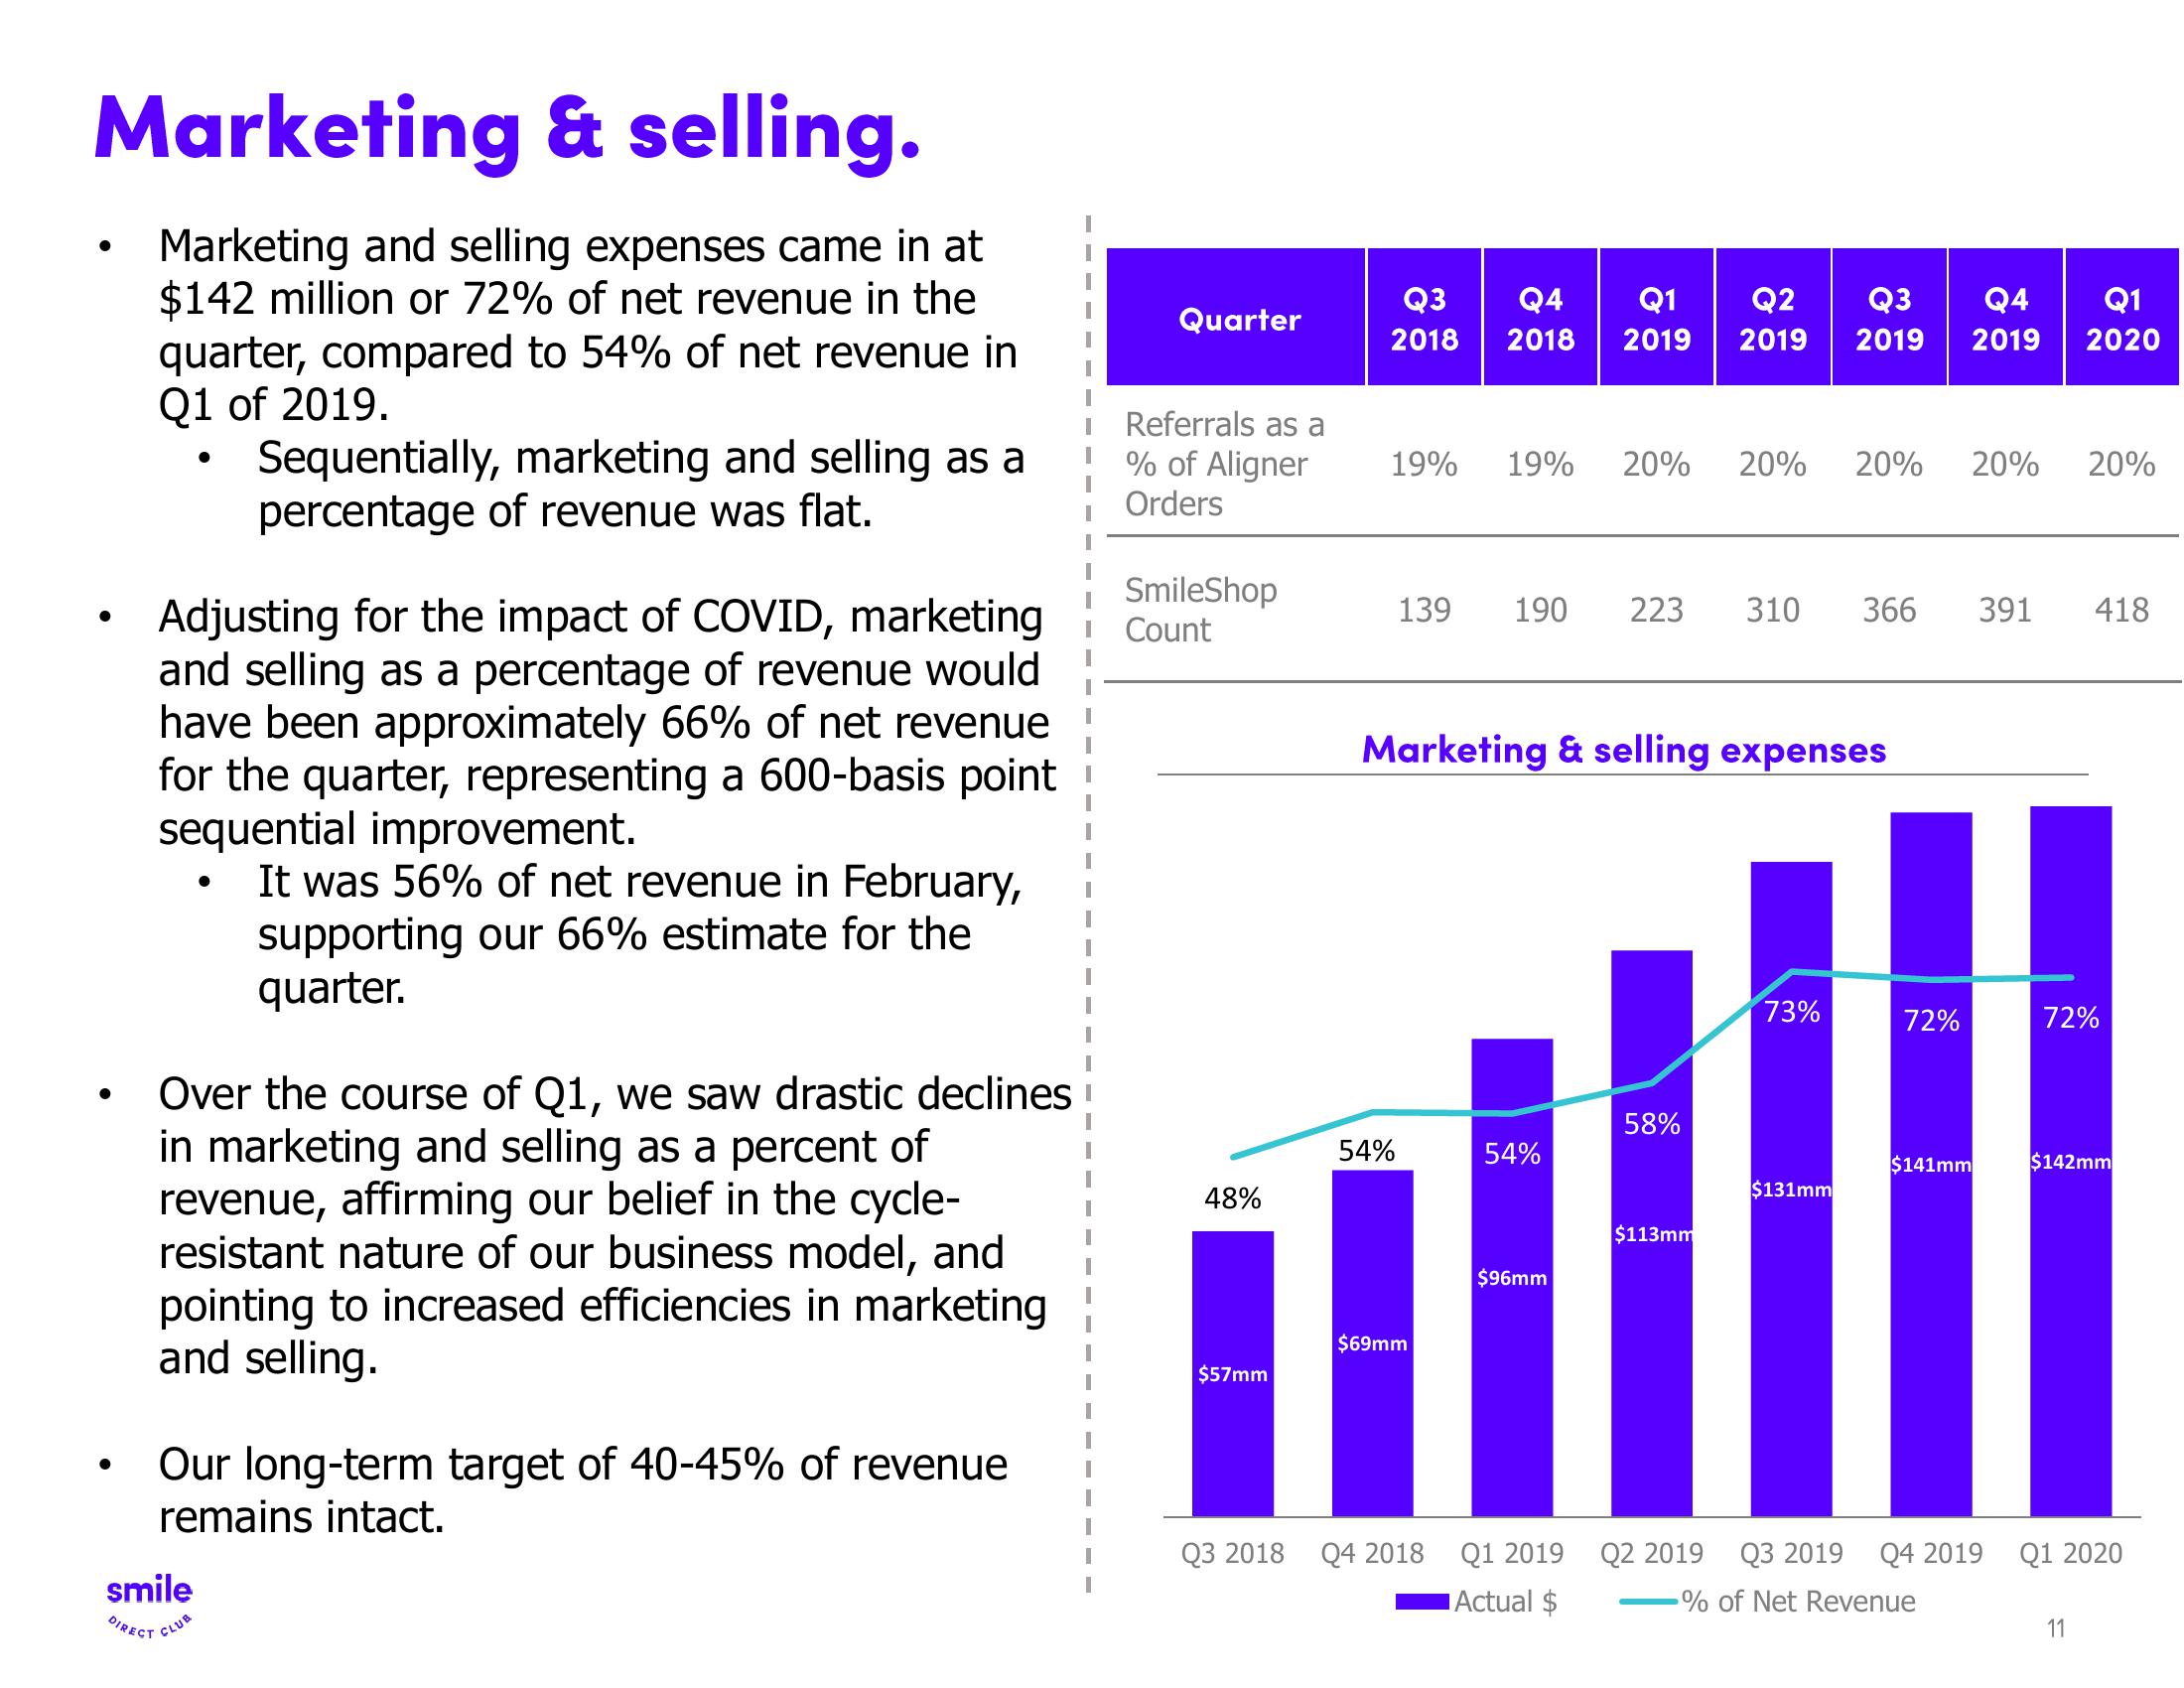
Marketing and selling expenses came in at
$142 million or 72% of net revenue in the
quarter, compared to 54% of net revenue in
Q1 of 2019.
●
●
Adjusting for the impact of COVID, marketing
and selling as a percentage of revenue would
have been approximately 66% of net revenue
for the quarter, representing a 600-basis point
sequential improvement.
It was 56% of net revenue in February,
supporting our 66% estimate for the
quarter.
Sequentially, marketing and selling as a
percentage of revenue was flat.
●
smile
DIRECT CLUB
Over the course of Q1, we saw drastic declines
in marketing and selling as a percent of
revenue, affirming our belief in the cycle-
resistant nature of our business model, and
pointing to increased efficiencies in marketing
and selling.
Our long-term target of 40-45% of revenue
remains intact.
Quarter
Referrals as a
% of Aligner
Orders
SmileShop
Count
48%
$57mm
Q3
2018
19%
54%
Q4 Q1 Q2 Q3
2018 2019 2019 2019
19% 20%
139 190 223
$69mm
Marketing & selling expenses
54%
$96mm
Q3 2018 Q4 2018 Q1 2019
Actual $
58%
$113mm
20% 20% 20% 20%
310
73%
$131mm
Q2 2019 Q3 2019
366 391 418
72%
Q4 Q1
2019 2020
$141mm
Q4 2019
% of Net Revenue
72%
$142mm
Q1 2020
11View entire presentation