Q2 Quarter 2023
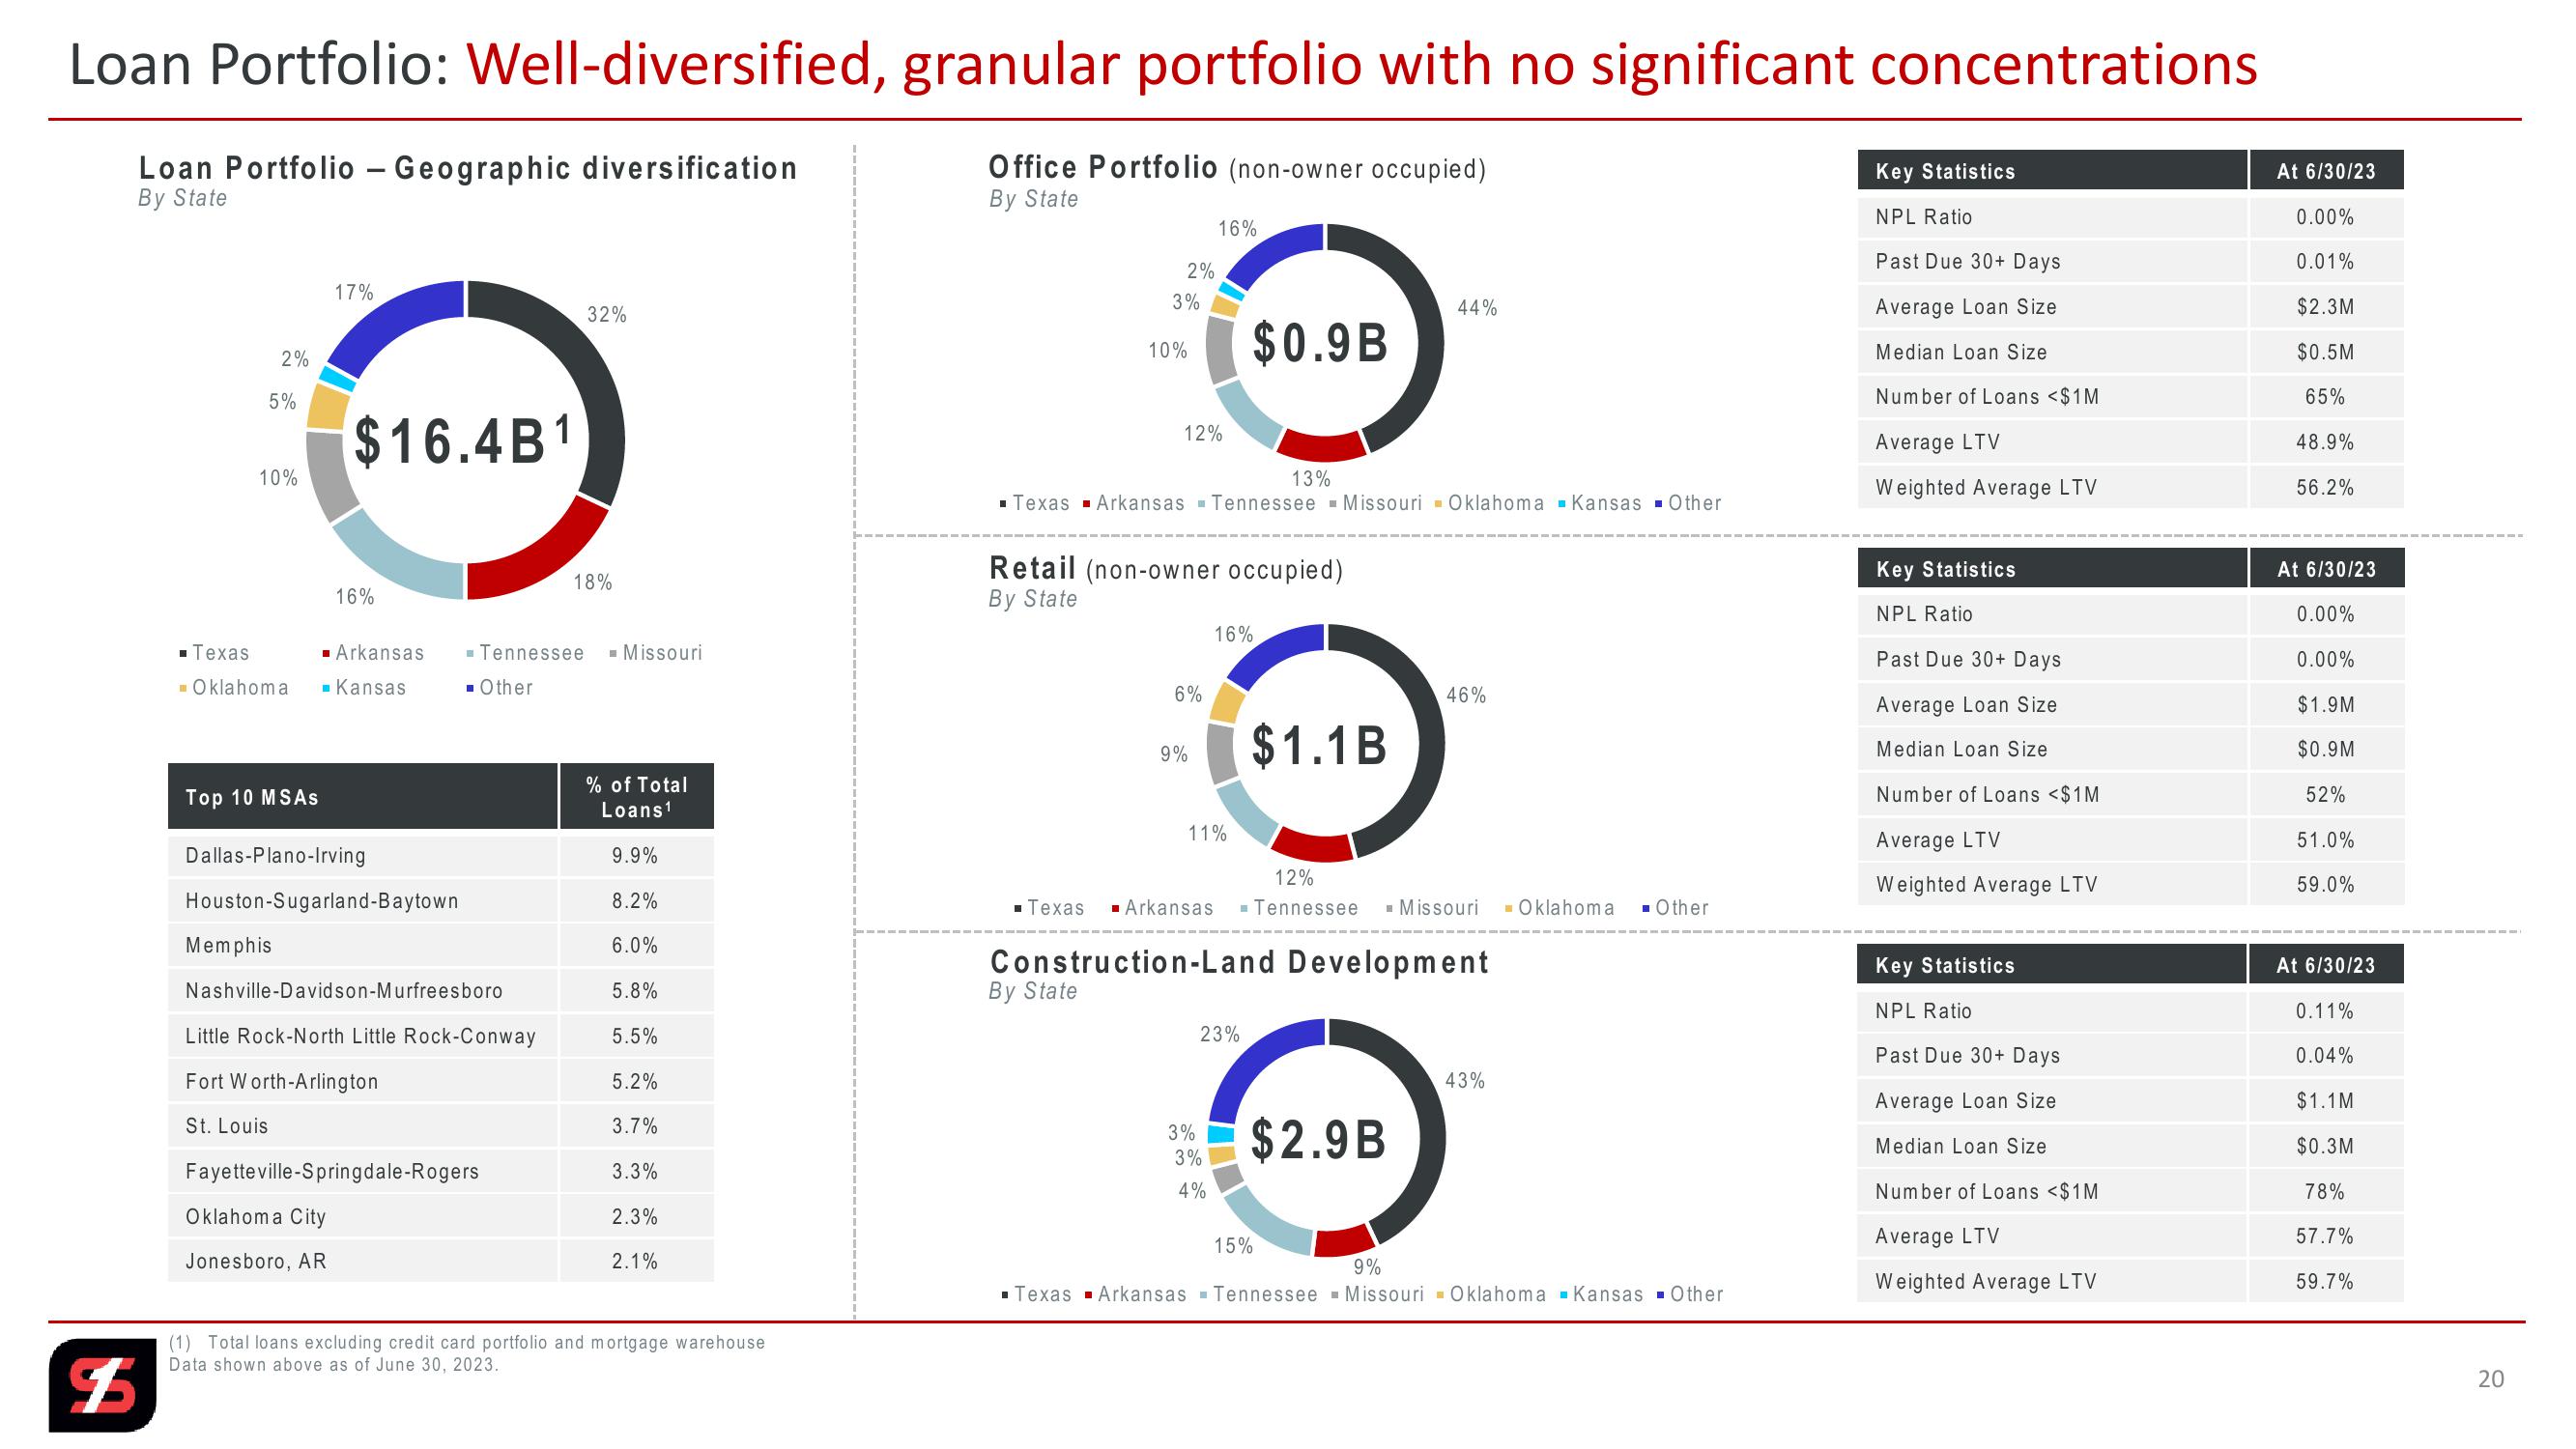
Loan Portfolio: Well-diversified, granular portfolio with no significant concentrations
Office Portfolio (non-owner occupied)
-
Loan Portfolio – Geographic diversification
By State
By State
Key Statistics
NPL Ratio
2%
5%
17%
32%
10%
$16.4B1
At 6/30/23
0.00%
16%
2%
3%
Past Due 30+ Days
0.01%
44%
Average Loan Size
$2.3M
10%
$0.9B
Median Loan Size
$0.5M
Number of Loans <$1M
65%
12%
Average LTV
48.9%
13%
Weighted Average LTV
56.2%
■ Texas Arkansas Tennessee Missouri Oklahoma Kansas ▪ Other
18%
16%
Retail (non-owner occupied)
By State
Key Statistics
At 6/30/23
NPL Ratio
0.00%
■ Texas
■ Arkansas
■ Tennessee ■ Missouri
■ Oklahoma
■ Kansas
■ Other
16%
6%
46%
9%
$1.1B
Past Due 30+ Days
0.00%
Average Loan Size
$1.9M
Median Loan Size
$0.9M
Top 10 MSAs
Dallas-Plano-Irving
Houston-Sugarland-Baytown
% of Total
Loans1
Number of Loans <$1M
52%
11%
Average LTV
51.0%
9.9%
12%
Weighted Average LTV
59.0%
8.2%
■ Texas ■ Arkansas ■ Tennessee ■ Missouri
■ Oklahoma
■ Other
Memphis
6.0%
Construction-Land Development
Key Statistics
At 6/30/23
Nashville-Davidson-Murfreesboro
5.8%
By State
NPL Ratio
0.11%
Little Rock-North Little Rock-Conway
5.5%
23%
Past Due 30+ Days
0.04%
Fort Worth-Arlington
5.2%
43%
Average Loan Size
$1.1M
St. Louis
3.7%
3%
3%
$2.9B
Median Loan Size
$0.3M
Fayetteville-Springdale-Rogers
3.3%
4%
Number of Loans <$1M
78%
Oklahoma City
2.3%
15%
Average LTV
57.7%
Jonesboro, AR
2.1%
9%
Weighted Average LTV
59.7%
■Texas Arkansas Tennessee Missouri Oklahoma Kansas Other
$
(1) Total loans excluding credit card portfolio and mortgage warehouse
Data shown above as of June 30, 2023.
20
20View entire presentation