KKR Real Estate Finance Trust Results Presentation Deck
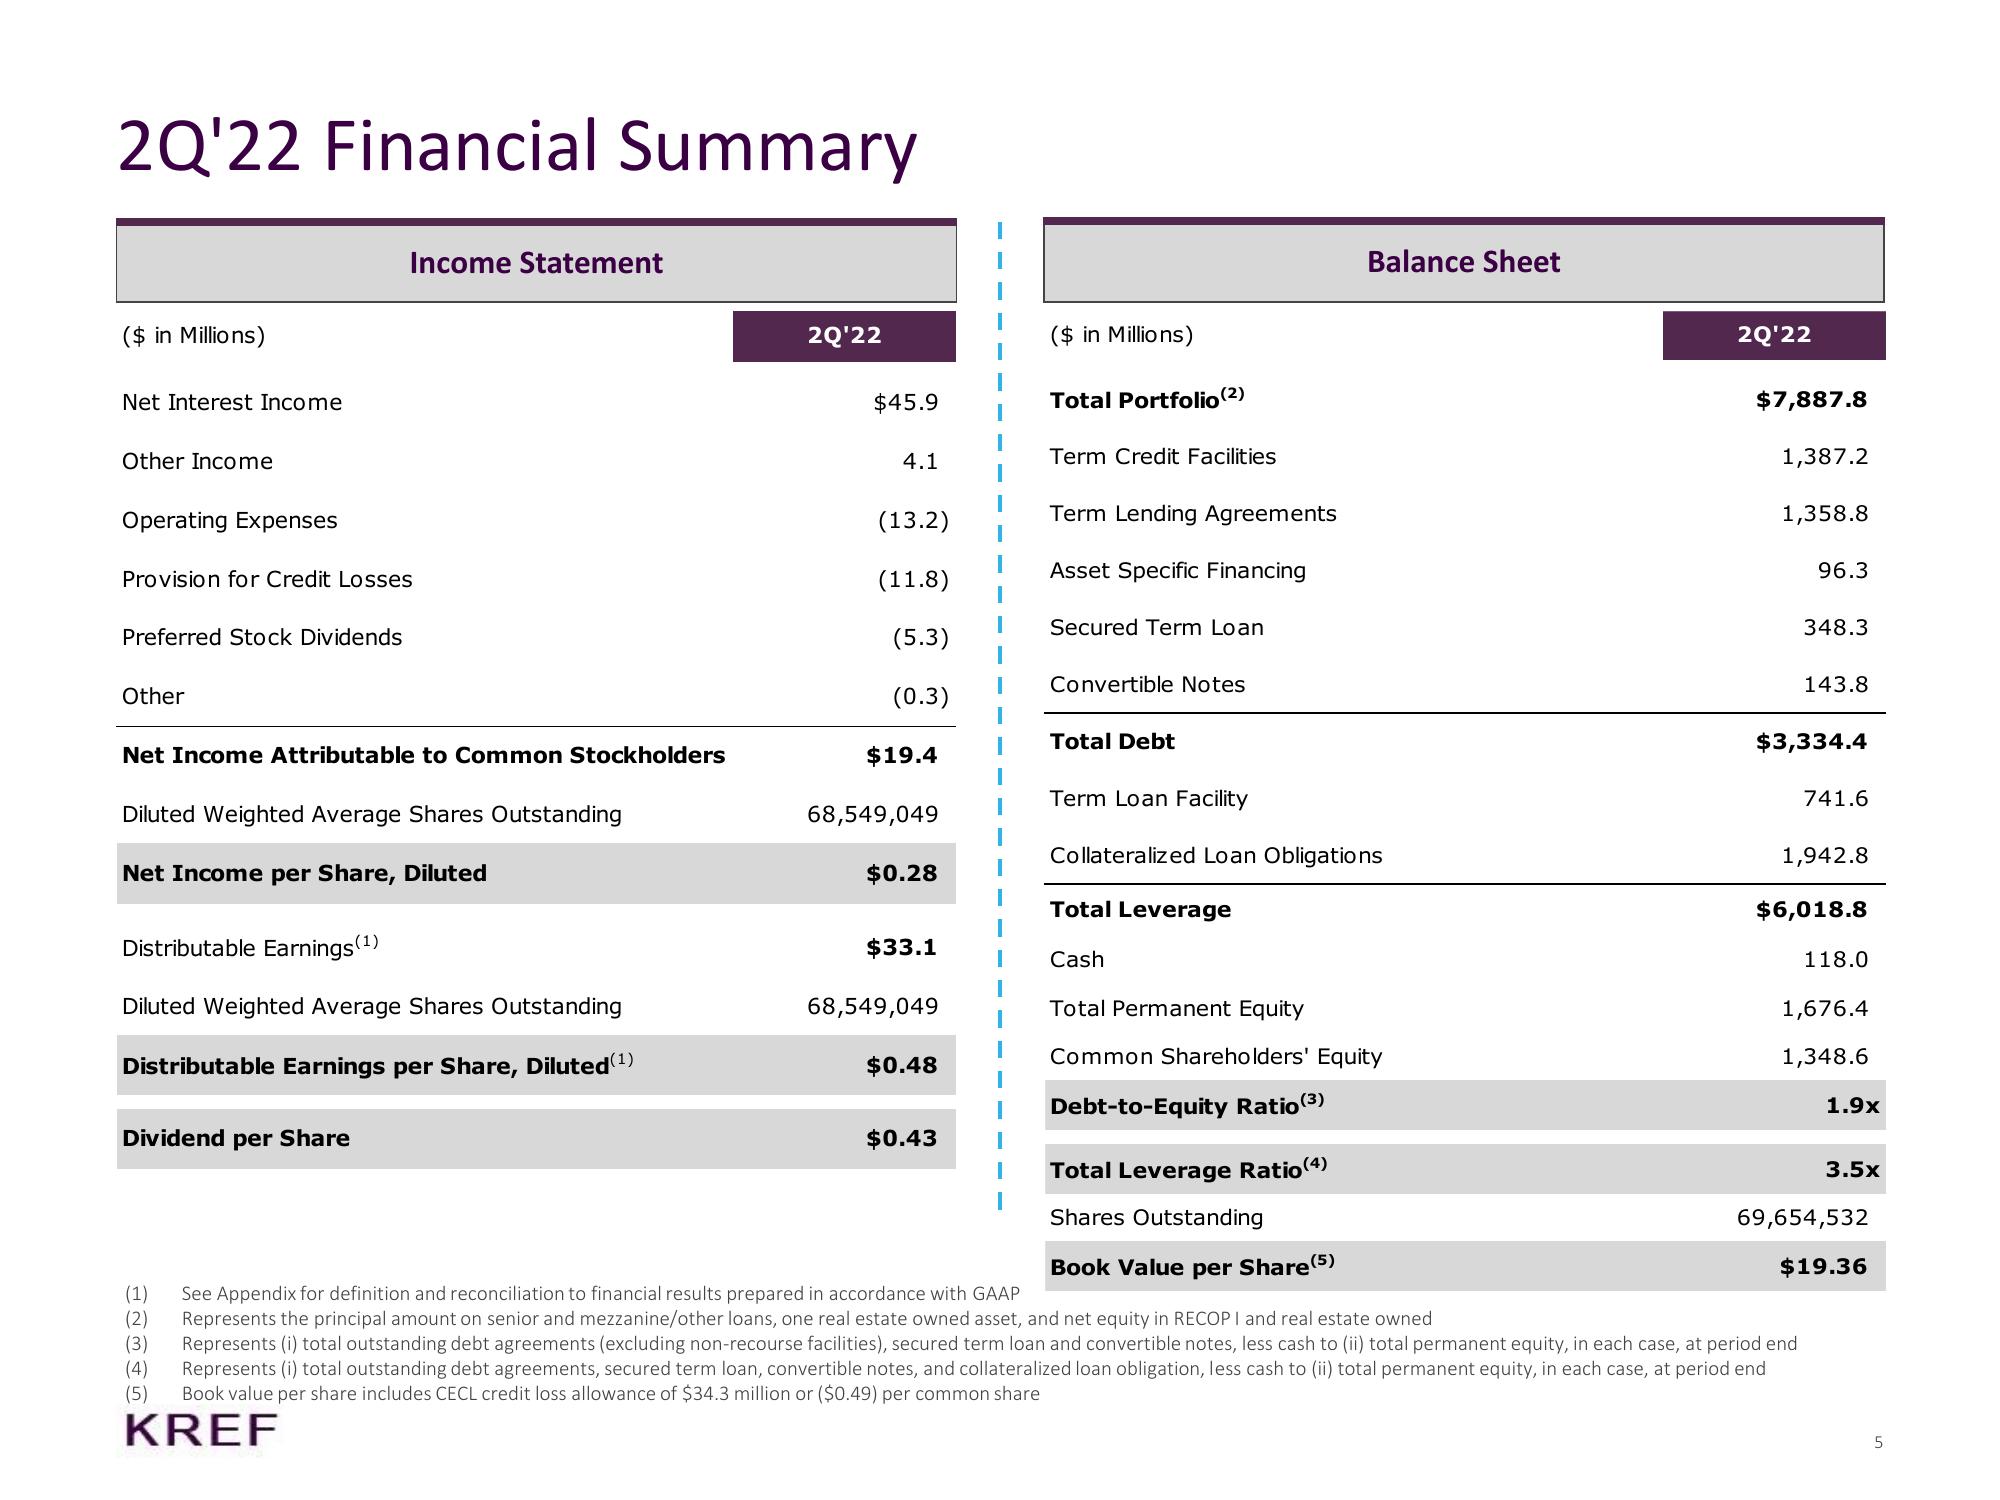
2Q'22 Financial Summary
($ in Millions)
Net Interest Income
Other Income
Operating Expenses
Provision for Credit Losses
Preferred Stock Dividends
Other
Net Income Attributable to Common Stockholders
Income Statement
Diluted Weighted Average Shares Outstanding
Net Income per Share, Diluted
Distributable Earnings (¹)
Diluted Weighted Average Shares Outstanding
Distributable Earnings per Share, Diluted (¹)
Dividend per Share
(1)
(2)
(3
(4)
(5)
2Q'22
$45.9
4.1
(13.2)
(11.8)
(5.3)
(0.3)
$19.4
68,549,049
$0.28
$33.1
68,549,049
$0.48
$0.43
($ in Millions)
Total Portfolio (2)
Term Credit Facilities
Term Lending Agreements
Asset Specific Financing
Secured Term Loan
Convertible Notes
Total Debt
Balance Sheet
Term Loan Facility
Collateralized Loan Obligations
Total Leverage
Cash
Total Permanent Equity
Common Shareholders' Equity
Debt-to-Equity Ratio (3)
2Q'22
$7,887.8
1,387.2
1,358.8
96.3
348.3
Total Leverage Ratio (4)
Shares Outstanding
Book Value per Share (5)
See Appendix for definition and reconciliation to financial results prepared in accordance with GAAP
Represents the principal amount on senior and mezzanine/other loans, one real estate owned asset, and net equity in RECOPI and real estate owned
Represents (i) total outstanding debt agreements (excluding non-recourse facilities), secured term loan and convertible notes, less cash to (ii) total permanent equity, in each case, at period end
Represents (i) total outstanding debt agreements, secured term loan, convertible notes, and collateralized loan obligation, less cash to (ii) total permanent equity, in each case, at period end
Book value per share includes CECL credit loss allowance of $34.3 million or ($0.49) per common share
KREF
143.8
$3,334.4
741.6
1,942.8
$6,018.8
118.0
1,676.4
1,348.6
1.9x
3.5x
69,654,532
$19.36
5View entire presentation