Marten Transport Results Presentation Deck
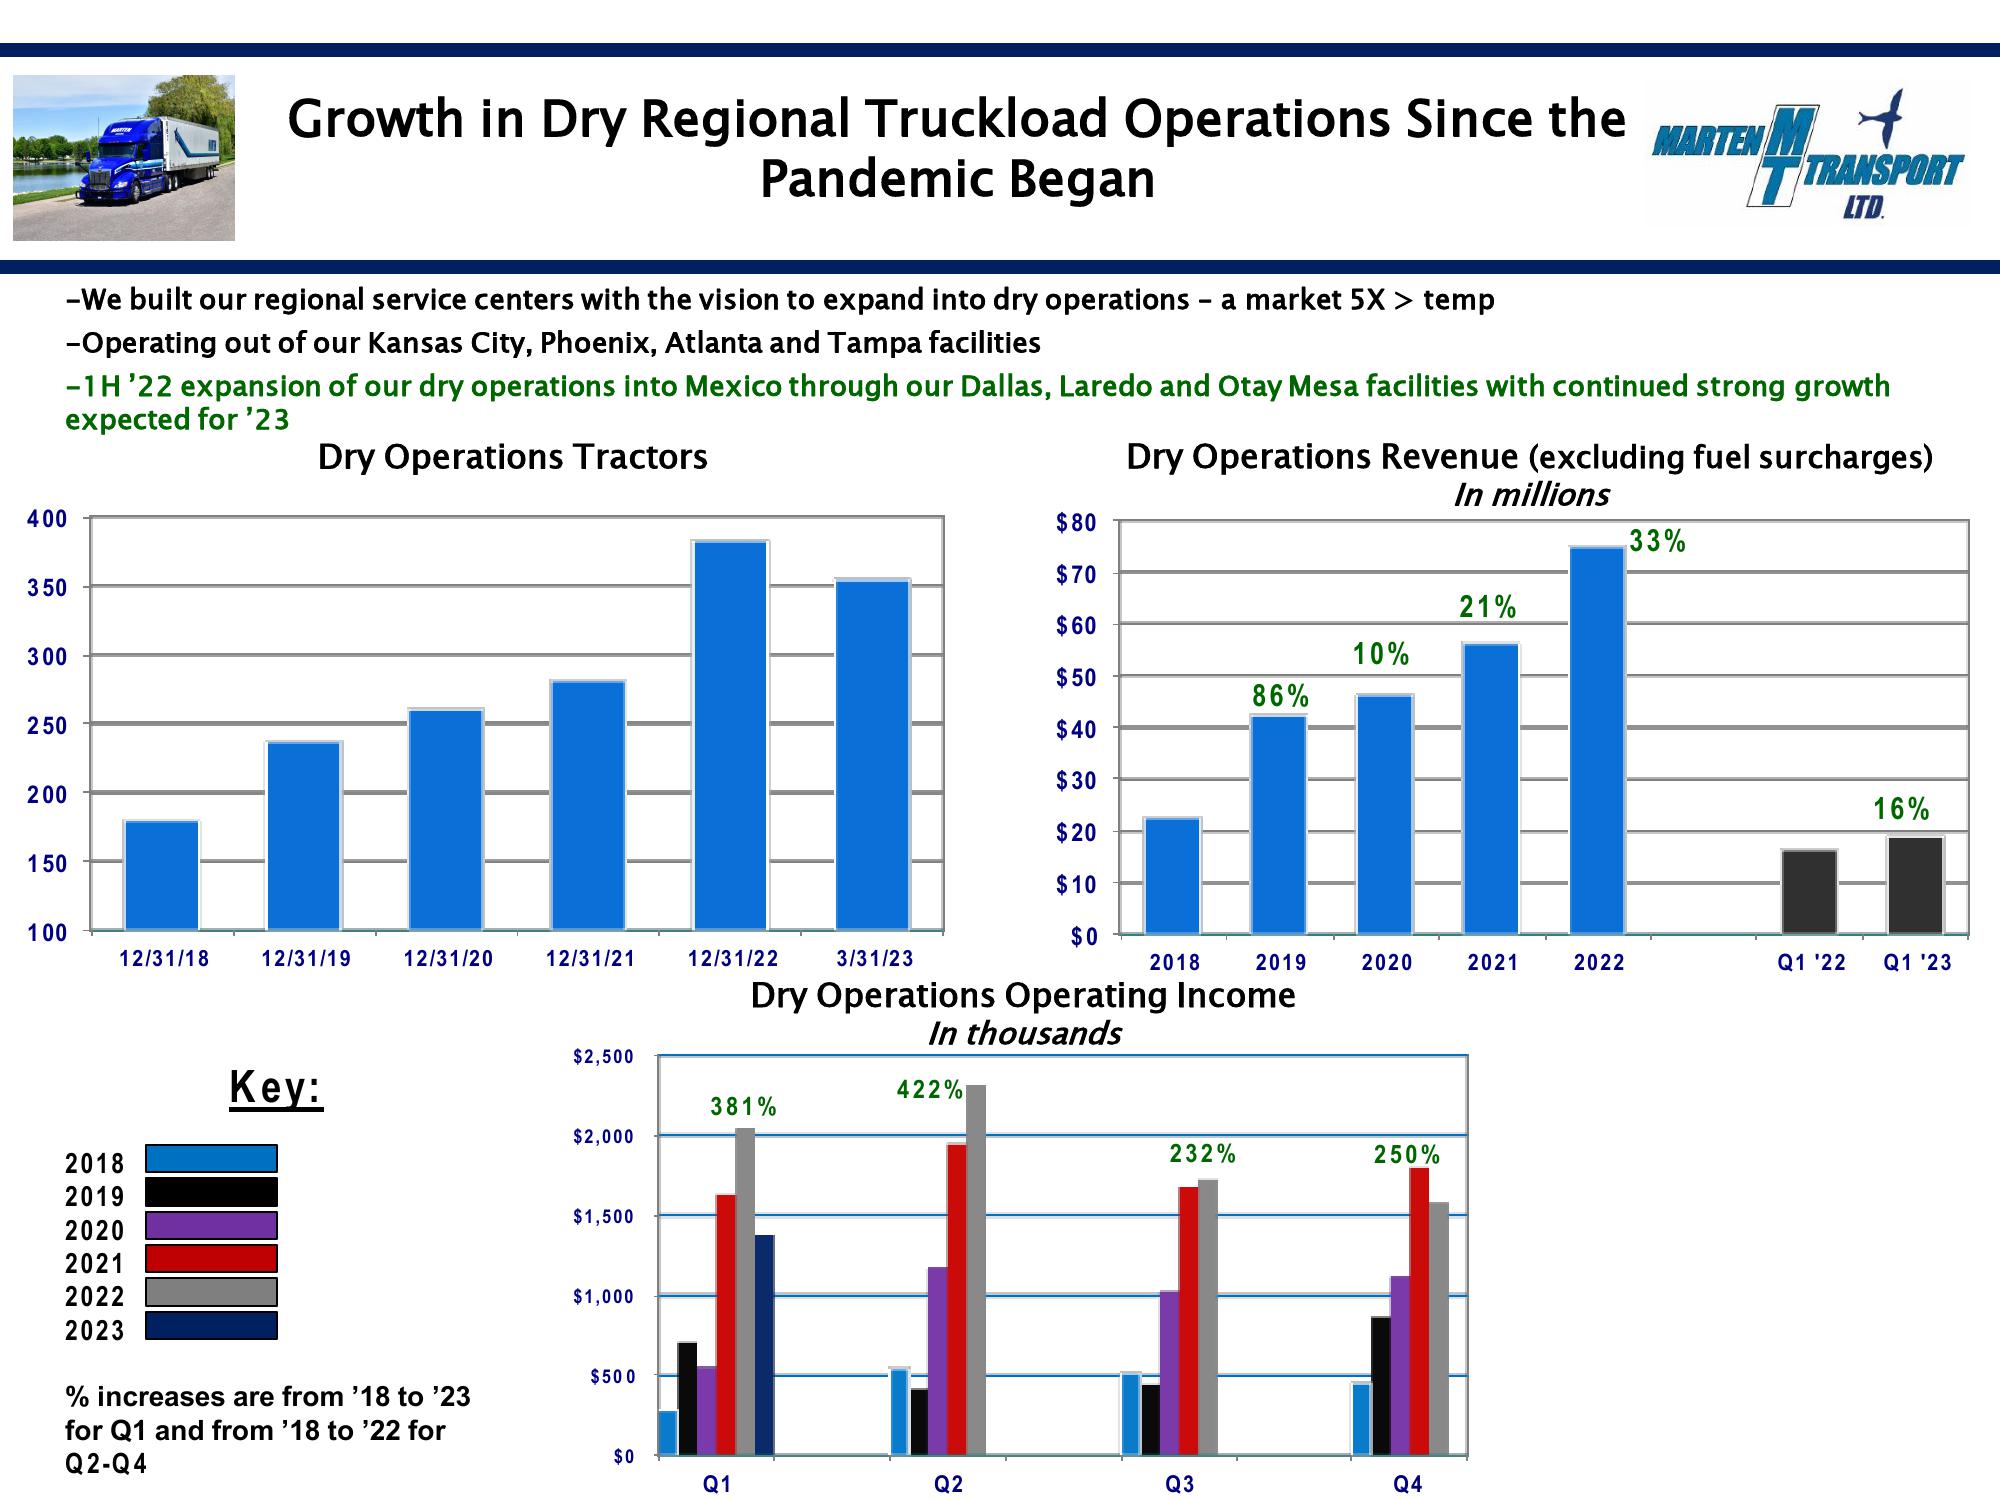
-We built our regional service centers with the vision to expand into dry operations - a market 5X > temp
-Operating out of our Kansas City, Phoenix, Atlanta and Tampa facilities
-1H '22 expansion of our dry operations into Mexico through our Dallas, Laredo and Otay Mesa facilities with continued strong growth
expected for '23
Dry Operations Tractors
400
350
300
250
200
150
100
12/31/18
Growth in Dry Regional Truckload Operations Since the EM +
MARTEN
Pandemic Began
TRANSPORT
LTD.
2018
2019
2020
2021
2022
2023
12/31/19
Key:
12/31/20
% increases are from '18 to '23
for Q1 and from '18 to '22 for
Q2-Q4
12/31/21
$2,500
$2,000
$1,500
$1,000
$500
$0
12/31/22
$80
$70
$60
$50
$40
$30
$20
$10
$0
3/31/23
2019
Dry Operations Operating Income
In thousands
422%
381%
Q1
Dry Operations Revenue (excluding fuel surcharges)
In millions
Q2
2018
232%
Q3
86%
10%
2020
250%
Q4
21%
2021
2022
33%
Q1 '22
16%
Q1 '23View entire presentation