J.P.Morgan Results Presentation Deck
Fortress balance sheet
$B, except per share data
Risk-based capital metrics¹
CET1 capital
CET1 capital ratio - Standardized
CET1 capital ratio - Advanced
Leverage-based capital metric²
Firm SLR
Liquidity metrics ³
Firm LCR
Bank LCR
Total excess HQLA
HQLA and unencumbered
marketable securities
2Q22
$207
12.2%
12.8
5.3%
110%
169
$554
1,568
1Q22
$3,841
2,532
69.53
$208
11.9%
12.7
5.2%
110%
181
$625
1,662
Balance sheet metrics
Total assets (EOP)
Deposits (average)
Tangible book value per share4
Note: Totals may not tie due to rounding
1 Estimated for the current period. See note 1 on slide 11
2 Estimated for the current period. Represents the supplementary leverage ratio ("SLR")
2Q21
$209
13.0%
13.8
5.4%
111%
171
$558
1,570
$3,955 $3,684
2,516
2,324
69.58
68.91
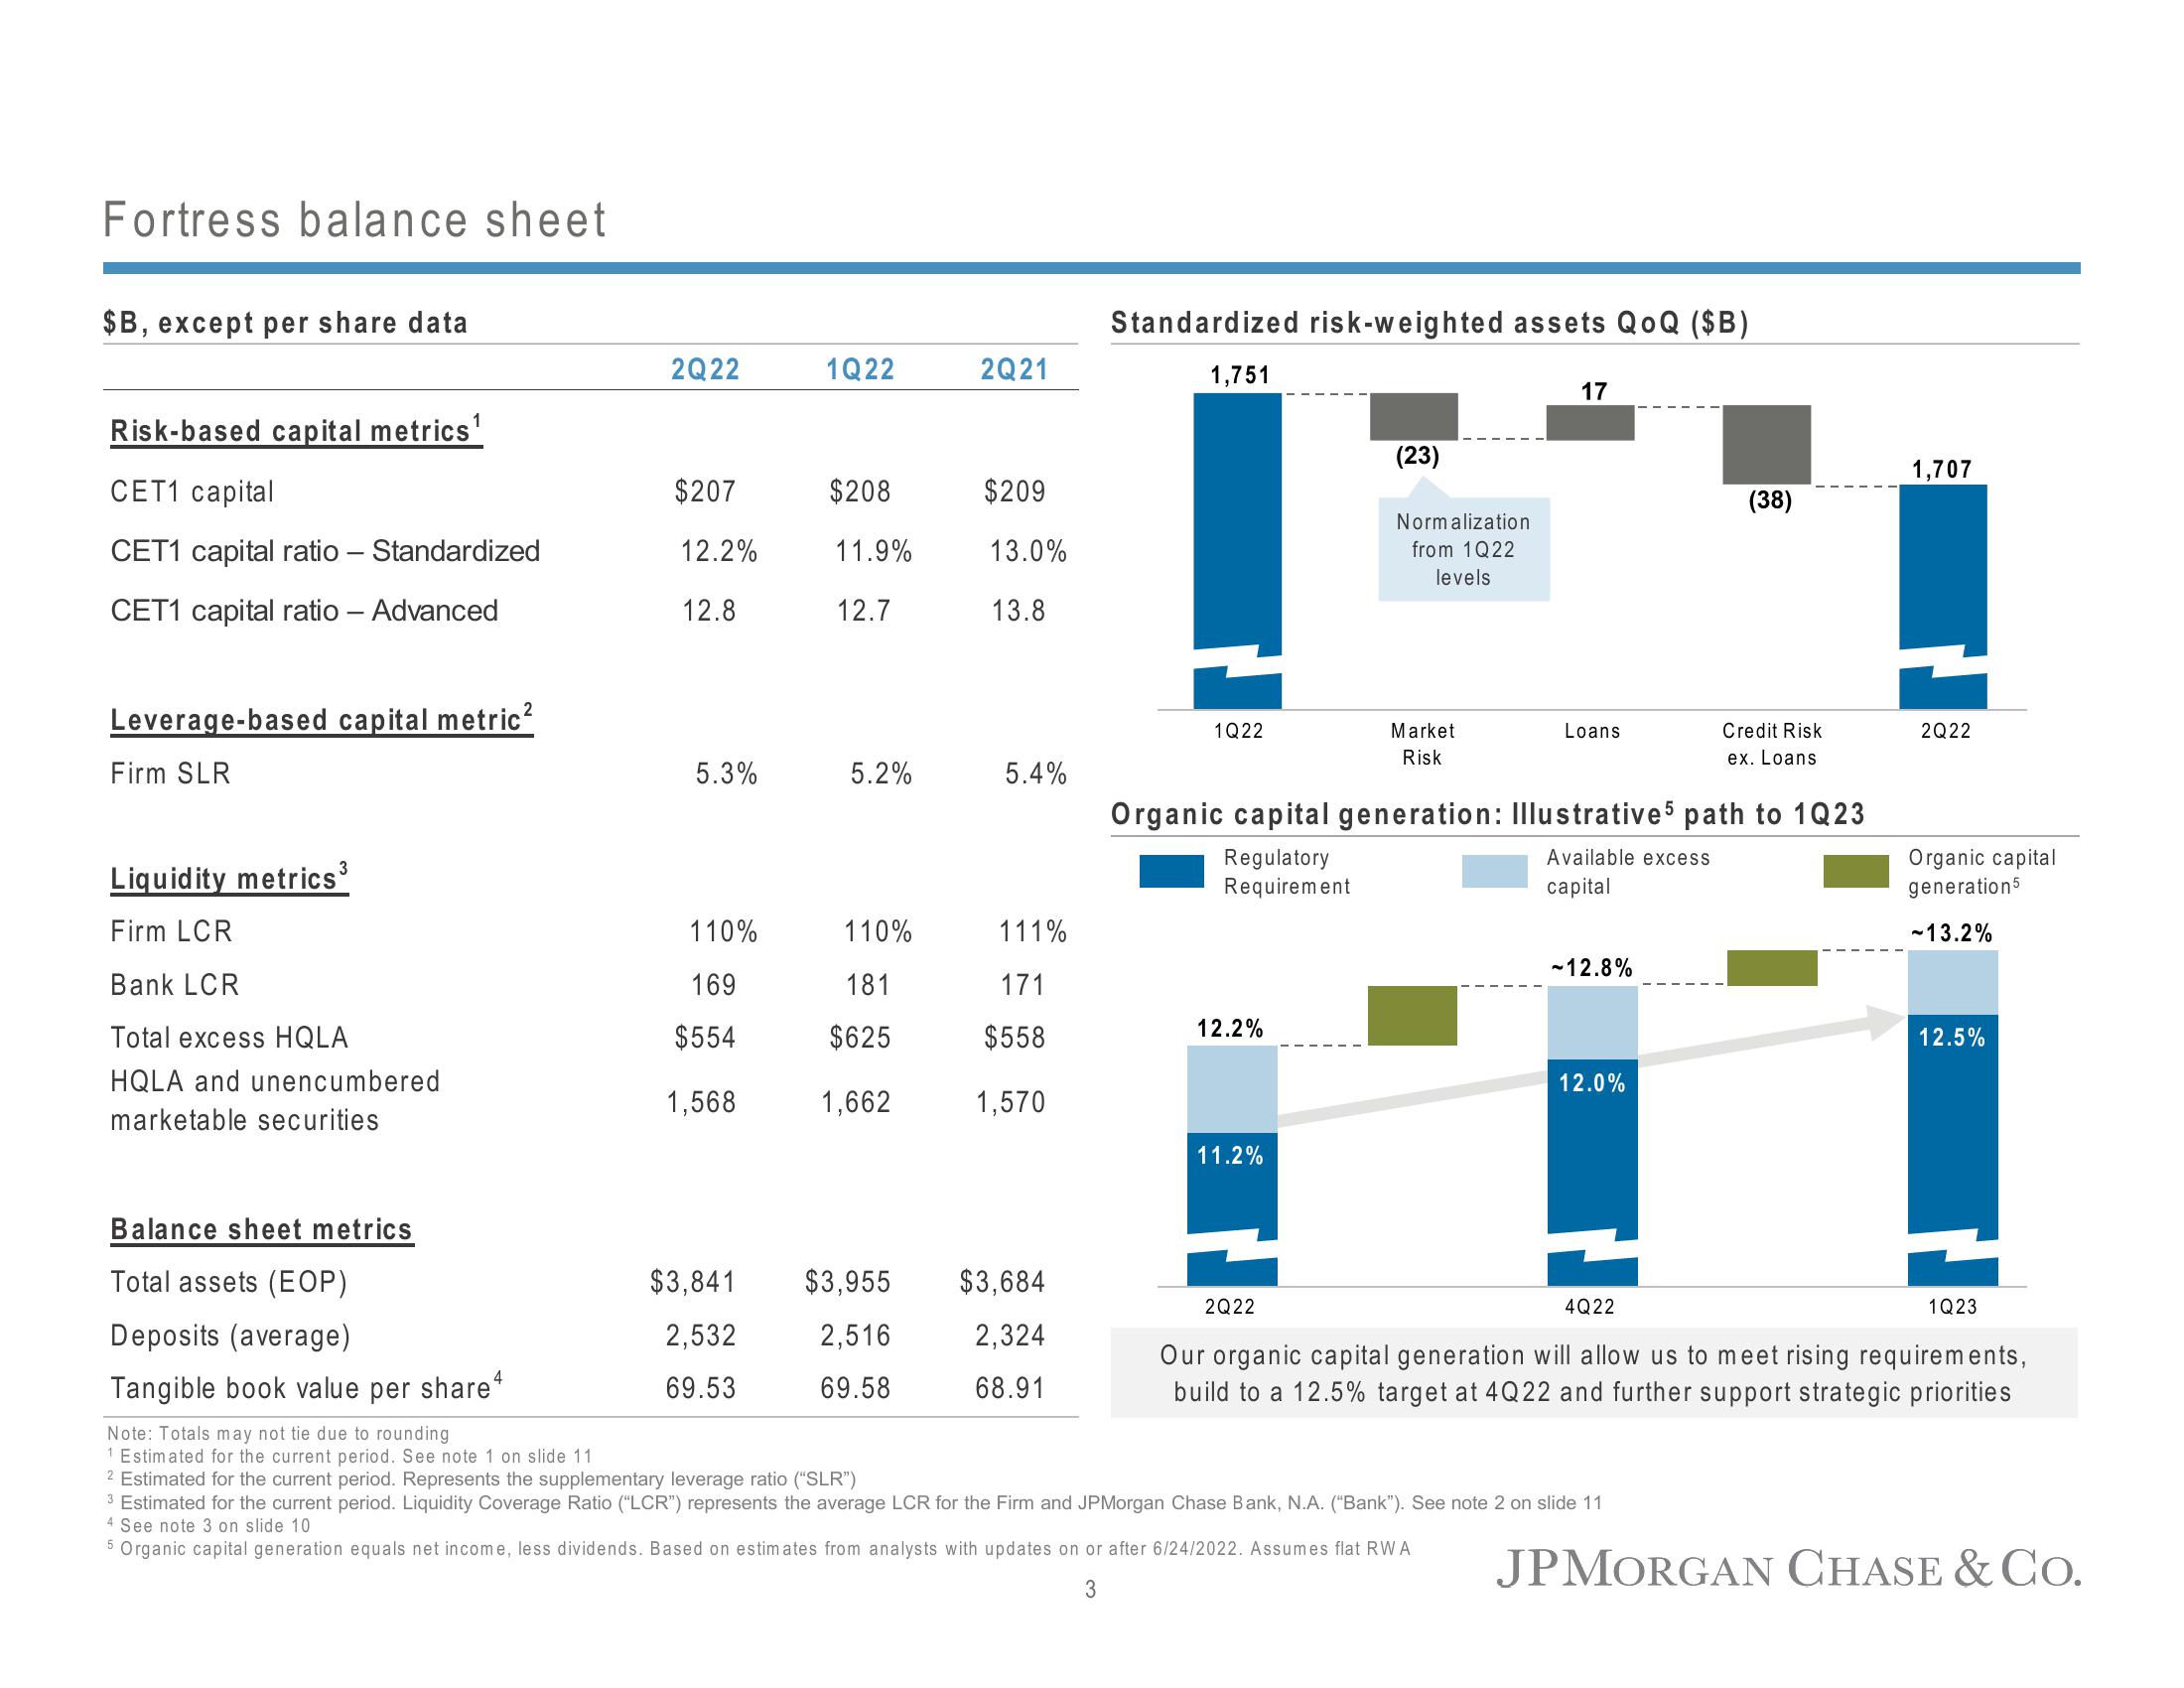
Standardized risk-weighted assets QoQ ($B)
1,751
1Q22
12.2%
11.2%
(23)
2Q22
Normalization
from 1Q22
levels
Market
Risk
17
Loans
Organic capital generation: Illustrative 5 path to 1Q23
Available excess
Regulatory
Requirement
capital
-12.8%
12.0%
4Q22
(38)
Credit Risk
ex. Loans
3 Estimated for the current period. Liquidity Coverage Ratio ("LCR") represents the average LCR for the Firm and JPMorgan Chase Bank, N.A. ("Bank"). See note 2 on slide 11
4 See note 3 on slide 10
5 Organic capital generation equals net income, less dividends. Based on estimates from analysts with updates on or after 6/24/2022. Assumes flat RWA
3
1,707
2Q22
Organic capital
generation 5
-13.2%
12.5%
1Q23
Our organic capital generation will allow us to meet rising requirements,
build to a 12.5% target at 4Q22 and further support strategic priorities
JPMORGAN CHASE & Co.View entire presentation