Q4 & FY 2018 Financial Results
FY Consolidated Results
($ in million)
Performance
Transportation
Net Sales
Net Income
3,026
1,644
4,670
207
Adjusted EBITDA
937
885
(1) Represents Net Income attributable to controlling interests
$4,353
(1)
PROPRIETARY
Financial Performance
0.6%
2018
FY
2.6%
2017 Volume Price
2017
Net Sales Variance
2,675
1,678
4,353
37
0.6%
% Change
Incl. FX
13.1 %
(2.0)%
7.3 %
5.9 %
3.5%
FX Acq.
Excl. FX
12.0%
(1.9)%
6.7 %
7.3%
$4,670
2018
8
Commentary
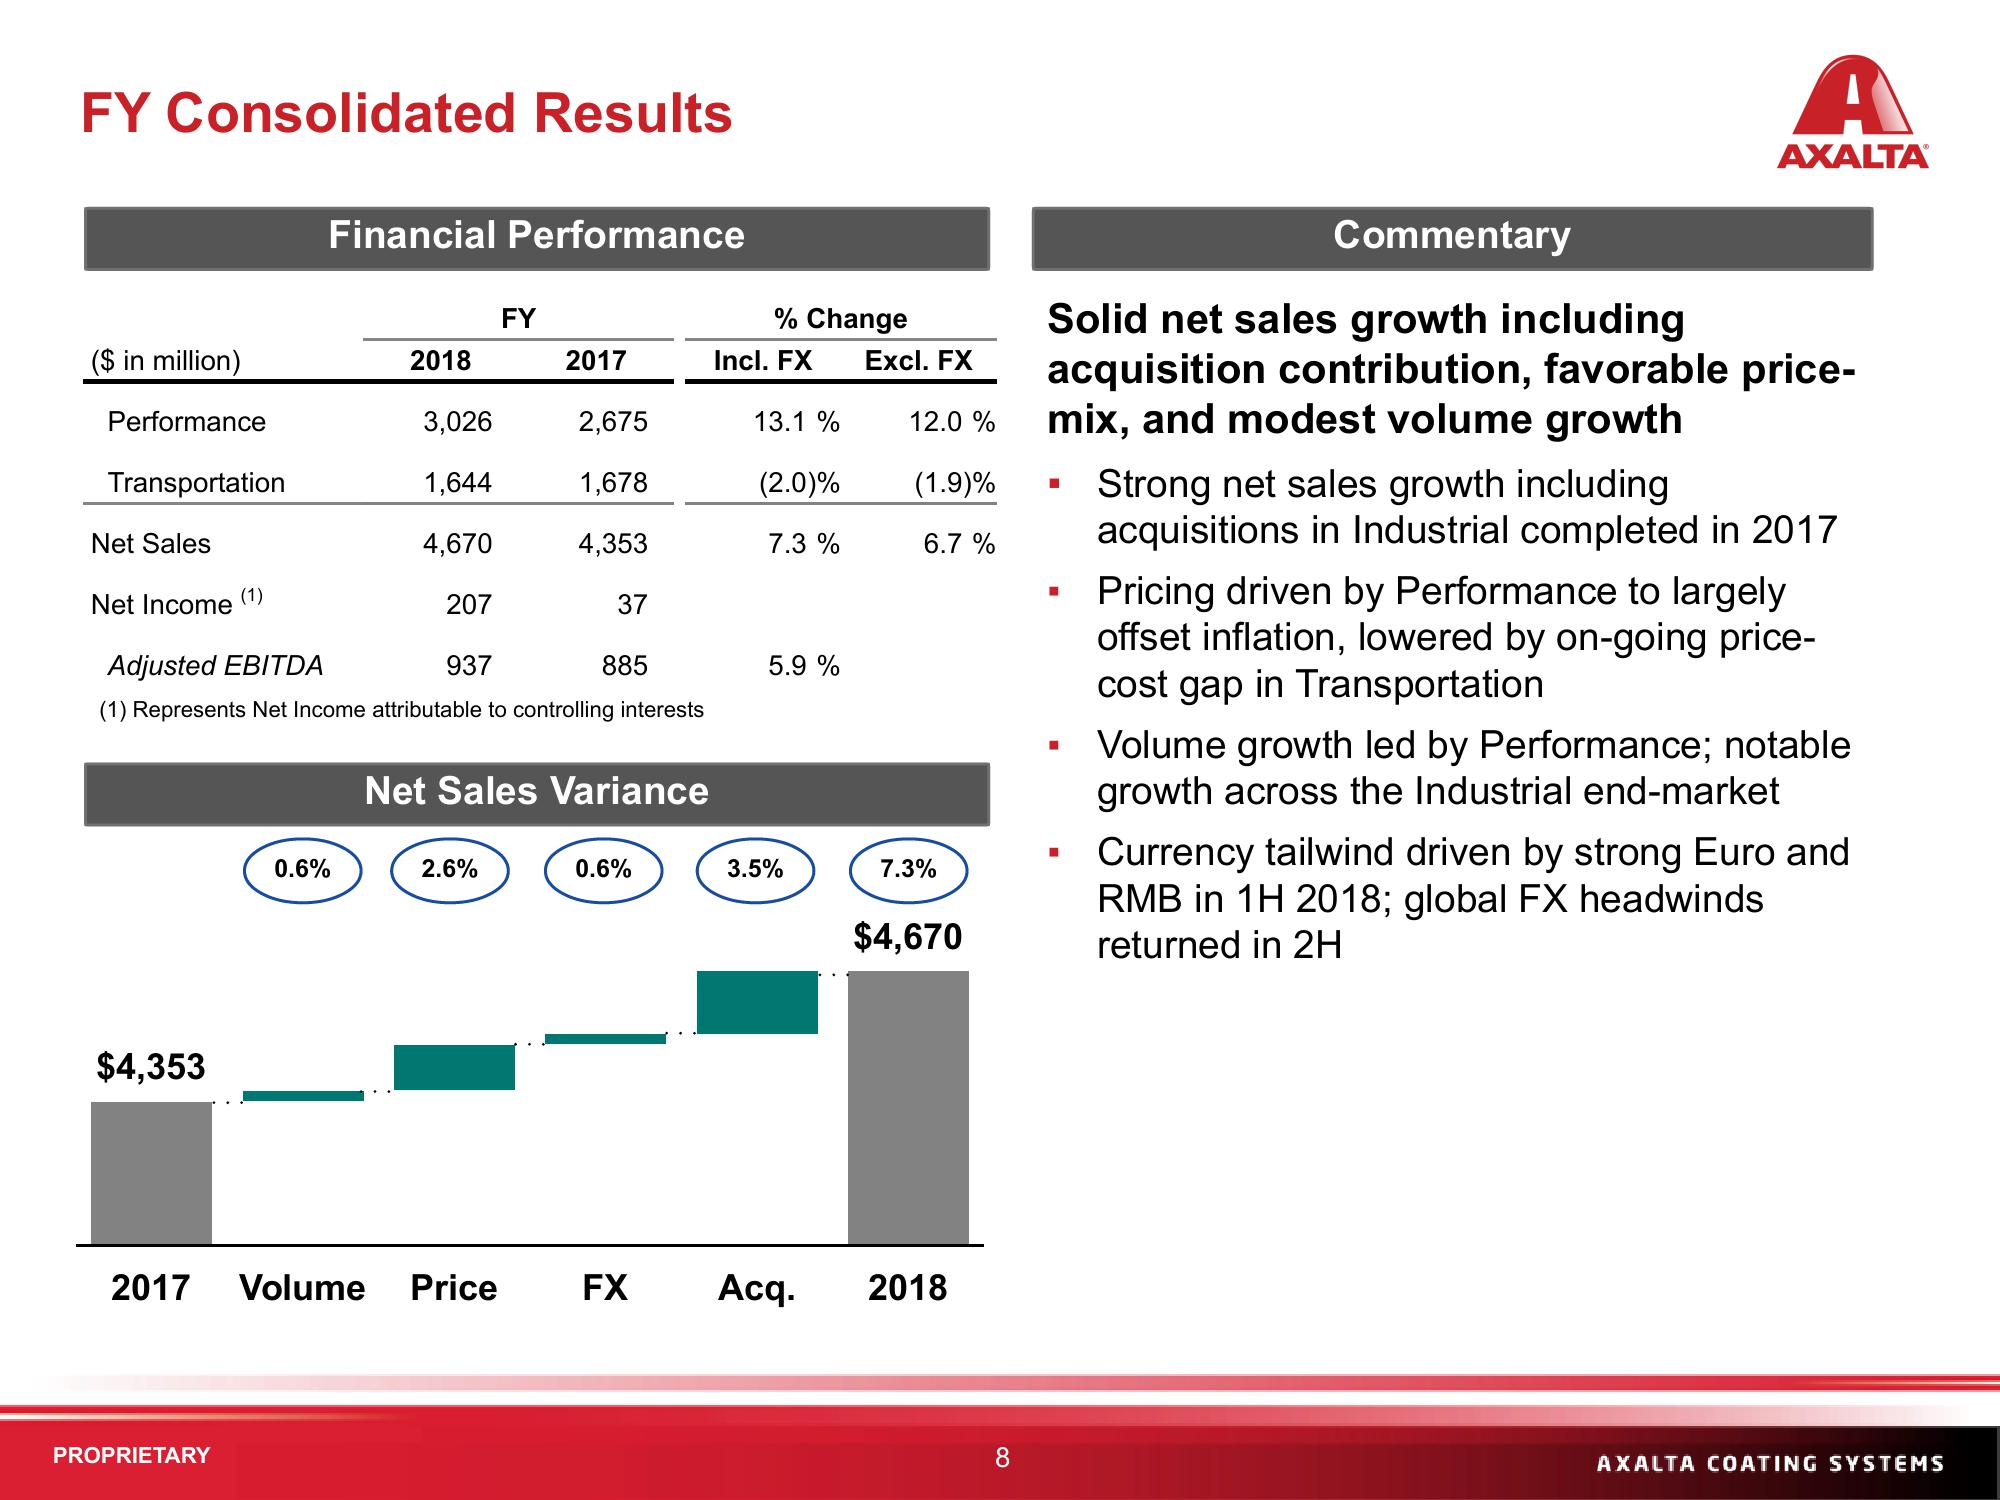
Solid net sales growth including
acquisition contribution, favorable price-
mix, and modest volume growth
■
■
I
A
AXALTAⓇ
■
Strong net sales growth including
acquisitions in Industrial completed in 2017
Pricing driven by Performance to largely
offset inflation, lowered by on-going price-
cost gap in Transportation
Volume growth led by Performance; notable
growth across the Industrial end-market
Currency tailwind driven by strong Euro and
RMB in 1H 2018; global FX headwinds
returned in 2H
AXALTA COATING SYSTEMSView entire presentation