Zegna Investor Presentation Deck
4. Key financials overview
ZEGNA GROUP
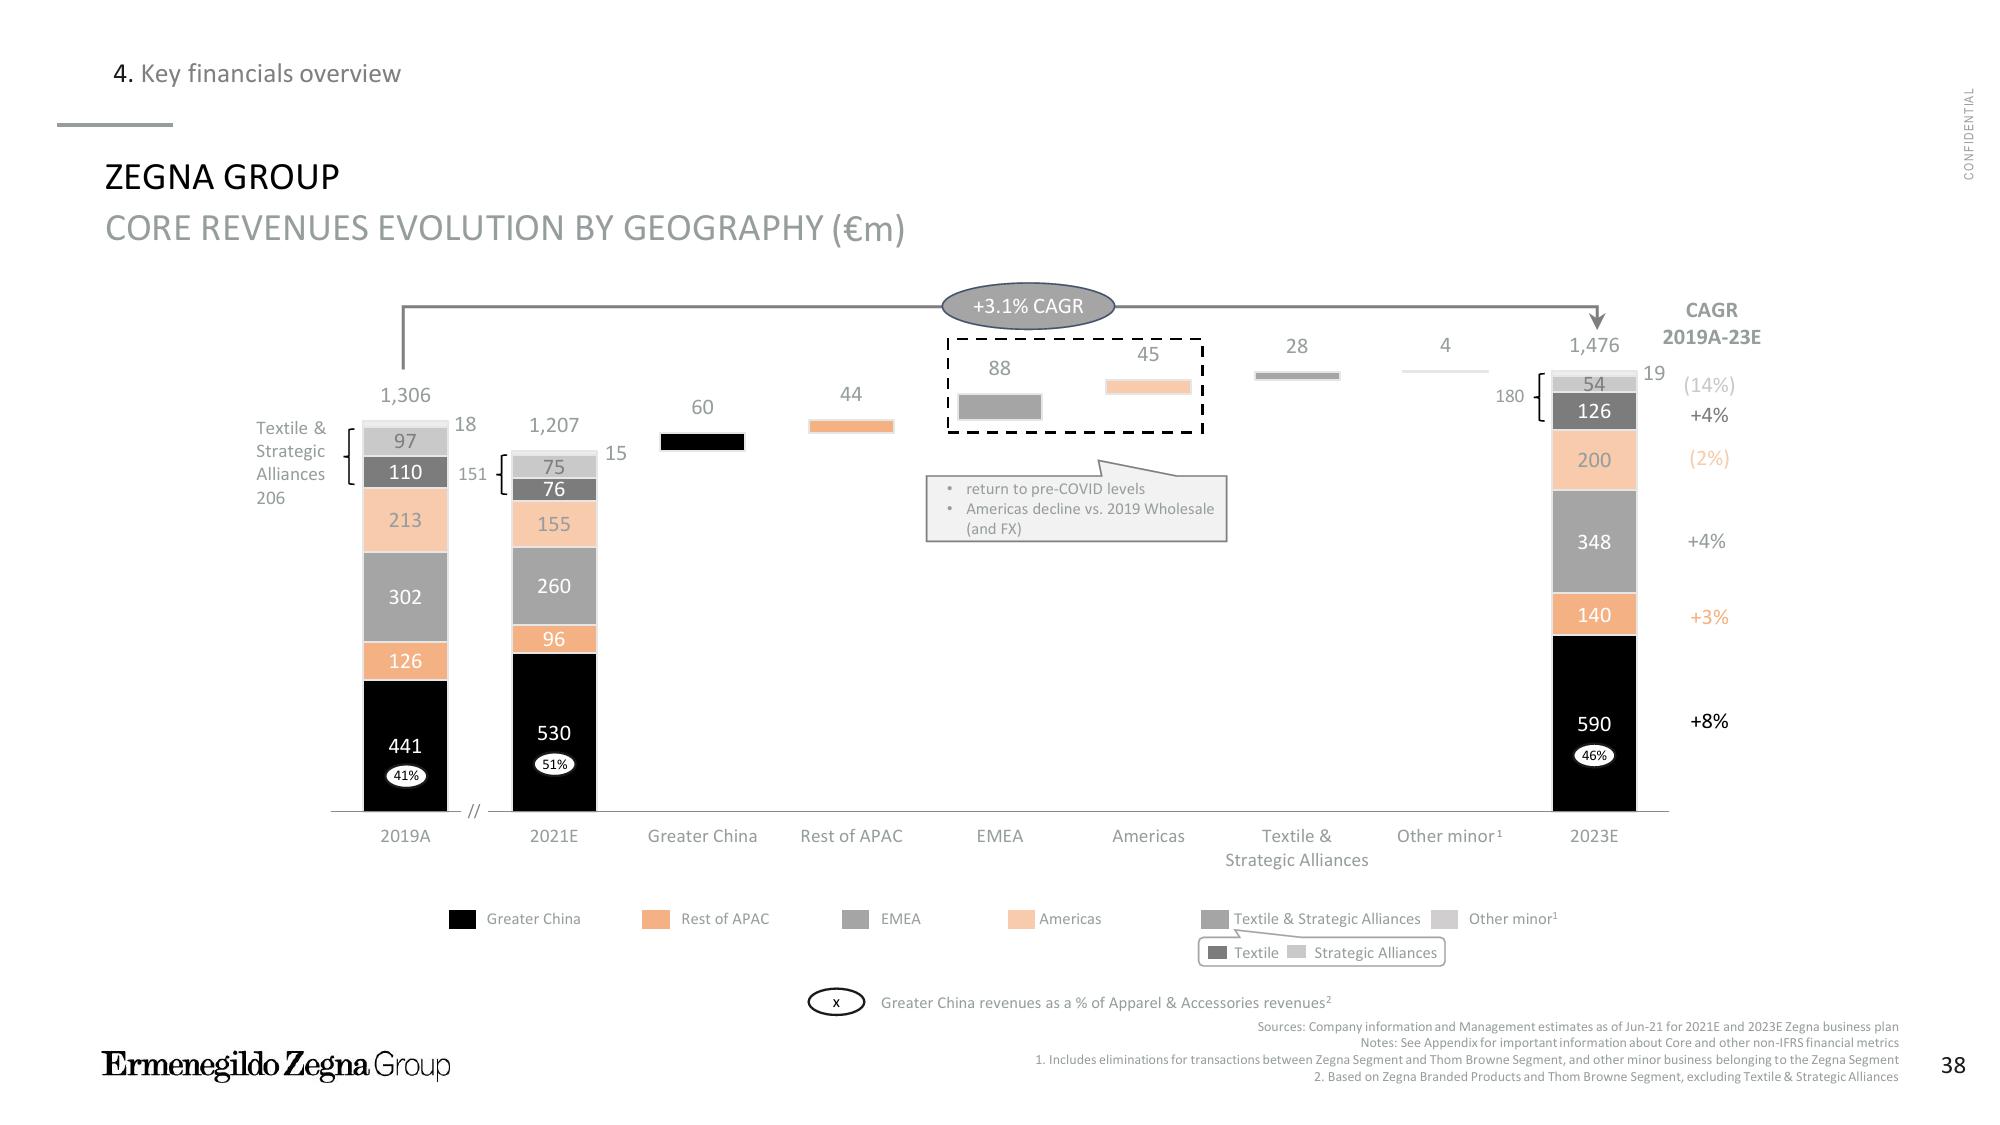
CORE REVENUES EVOLUTION BY GEOGRAPHY (€m)
Textile &
Strategic
Alliances
206
1,306
97
110 151
213
302
126
441
41%
2019A
Ermenegildo Zegna Group
18
//
1,207
75
76
155
260
96
530
51%
2021E
Greater China
15
60
Greater China
Rest of APAC
44
Rest of APAC
EMEA
1
I
+3.1% CAGR
•
88
return to pre-COVID levels
• Americas decline vs. 2019 Wholesale
(and FX)
EMEA
45
Americas
Americas
28
Textile &
Strategic Alliances
Textile & Strategic Alliances
Textile Strategic Alliances
Greater China revenues as a % of Apparel & Accessories revenues²
4
180
Other minor ¹
Other minor¹
1,476
54
126
200
348
140
590
46%
2023E
CAGR
2019A-23E
19
(14%)
+4%
(2%)
+4%
+3%
+8%
Sources: Company information and Management estimates as of Jun-21 for 2021E and 2023E Zegna business plan
Notes: See Appendix for important information about Core and other non-IFRS financial metrics
1. Includes eliminations for transactions between Zegna Segment and Thom Browne Segment, and other minor business belonging to the Zegna Segment
2. Based on Zegna Branded Products and Thom Browne Segment, excluding Textile & Strategic Alliances
CONFIDENTIAL
38View entire presentation