Clover Health Investor Day Presentation Deck
Annual Historical Financial Results
(in millions)
Counties
Average Membership
YOY Growth (%)
Total Revenue
YOY Growth (%)
Total Medical Costs
YOY Growth (%)
Gross Profit
Gross Margin (%)
MCR, Gross
Operating Expenses(3)
Other Income (Expenses)
2018A
Net Loss
19
31,485
$358(1)
$343(2)
$15
4.1%
97.1%
2019A
26
41,165
31%
$462
29%
$450
31%
$12
2.5%
98.8%
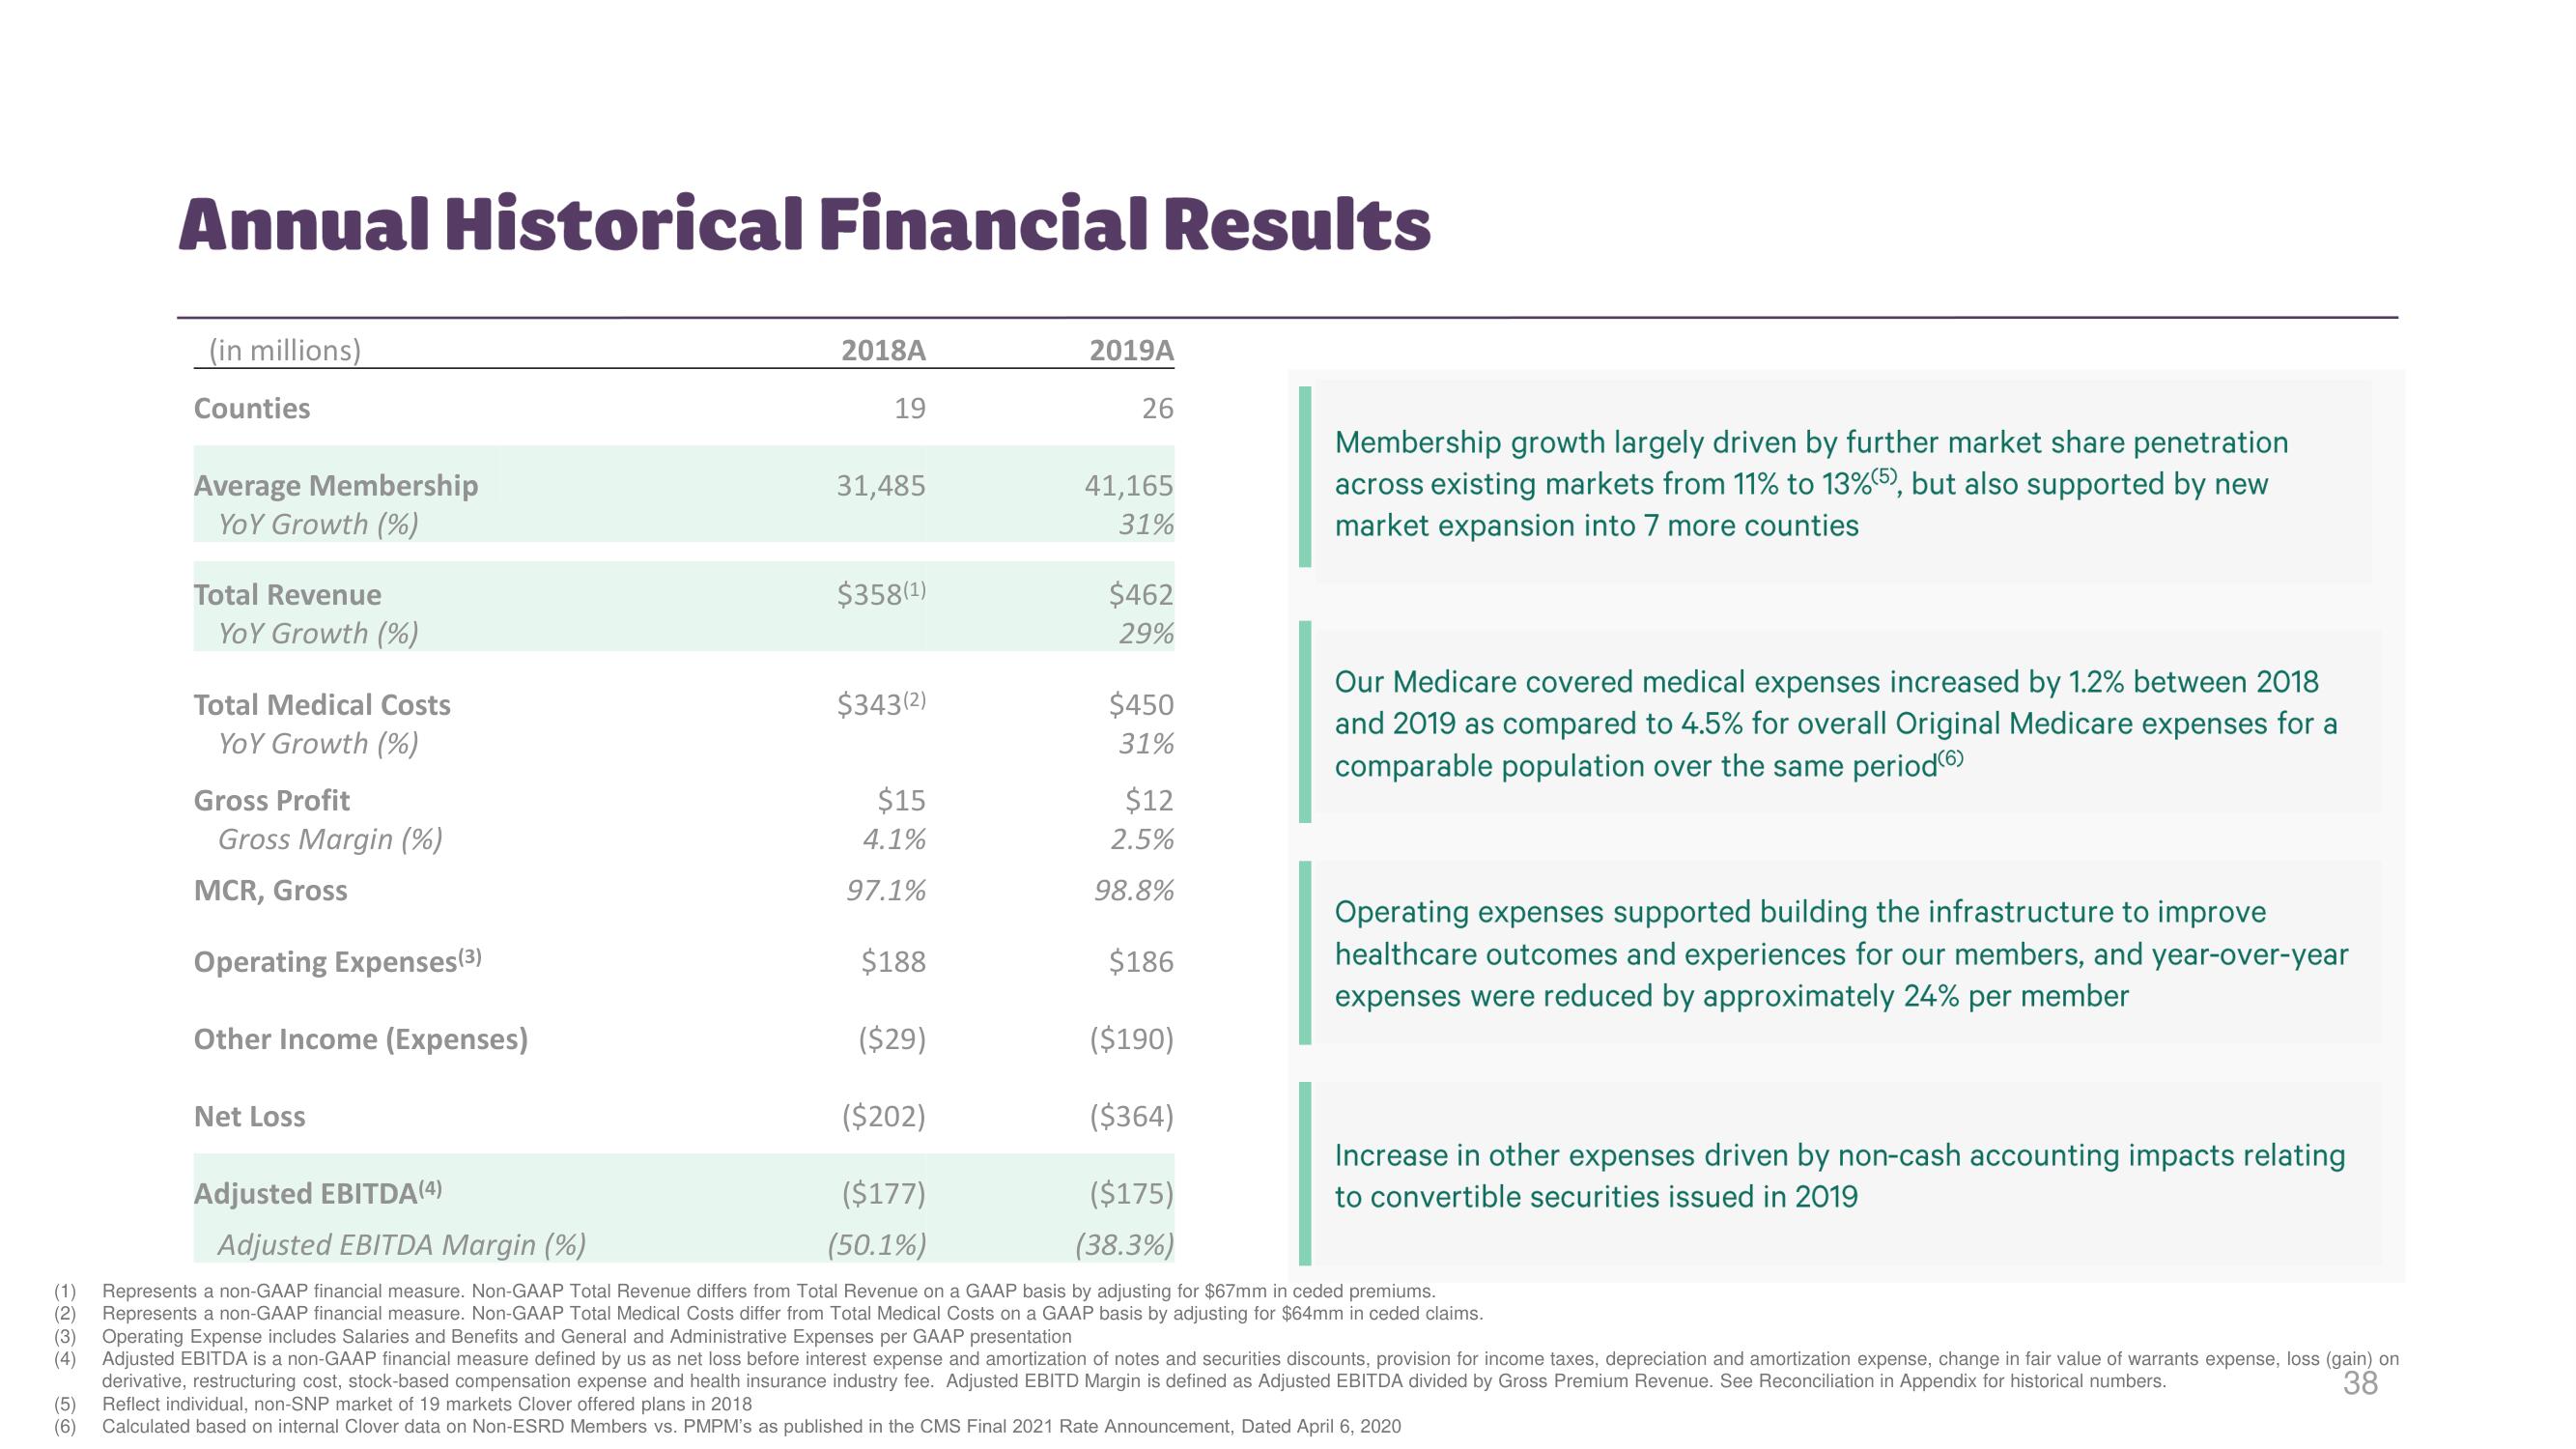
Membership growth largely driven by further market share penetration
across existing markets from 11% to 13%5), but also supported by new
market expansion into 7 more counties
Our Medicare covered medical expenses increased by 1.2% between 2018
and 2019 as compared to 4.5% for overall Original Medicare expenses for a
comparable population over the same period (6)
$188
$186
($29)
($190)
($202)
($364)
Adjusted EBITDA (4)
($177)
($175)
Adjusted EBITDA Margin (%)
(50.1%)
(38.3%)
(1)
(2)
Represents a non-GAAP financial measure. Non-GAAP Total Revenue differs from Total Revenue on a GAAP basis by adjusting for $67mm in ceded premiums.
Represents a non-GAAP financial measure. Non-GAAP Total Medical Costs differ from Total Medical Costs on a GAAP basis by adjusting for $64mm in ceded claims.
Operating Expense includes Salaries and Benefits and General and Administrative Expenses per GAAP presentation
(3)
(4) Adjusted EBITDA is a non-GAAP financial measure defined by us as net loss before interest expense and amortization of notes and securities discounts, provision for income taxes, depreciation and amortization expense, change in fair value of warrants expense, loss (gain) on
derivative, restructuring cost, stock-based compensation expense and health insurance industry fee. Adjusted EBITD Margin is defined Adjusted EBITDA divided by Gross Premium Revenue. See Reconciliation in Appendix for historical numbers.
38
(5) Reflect individual, non-SNP market of 19 markets Clover offered plans in 2018
(6) Calculated based on internal Clover data on Non-ESRD Members vs. PMPM's as published in the CMS Final 2021 Rate Announcement, Dated April 6, 2020
Operating expenses supported building the infrastructure to improve
healthcare outcomes and experiences for our members, and year-over-year
expenses were reduced by approximately 24% per member
Increase in other expenses driven by non-cash accounting impacts relating
to convertible securities issued in 2019View entire presentation