J.P.Morgan Investment Banking Pitch Book
APPENDIX
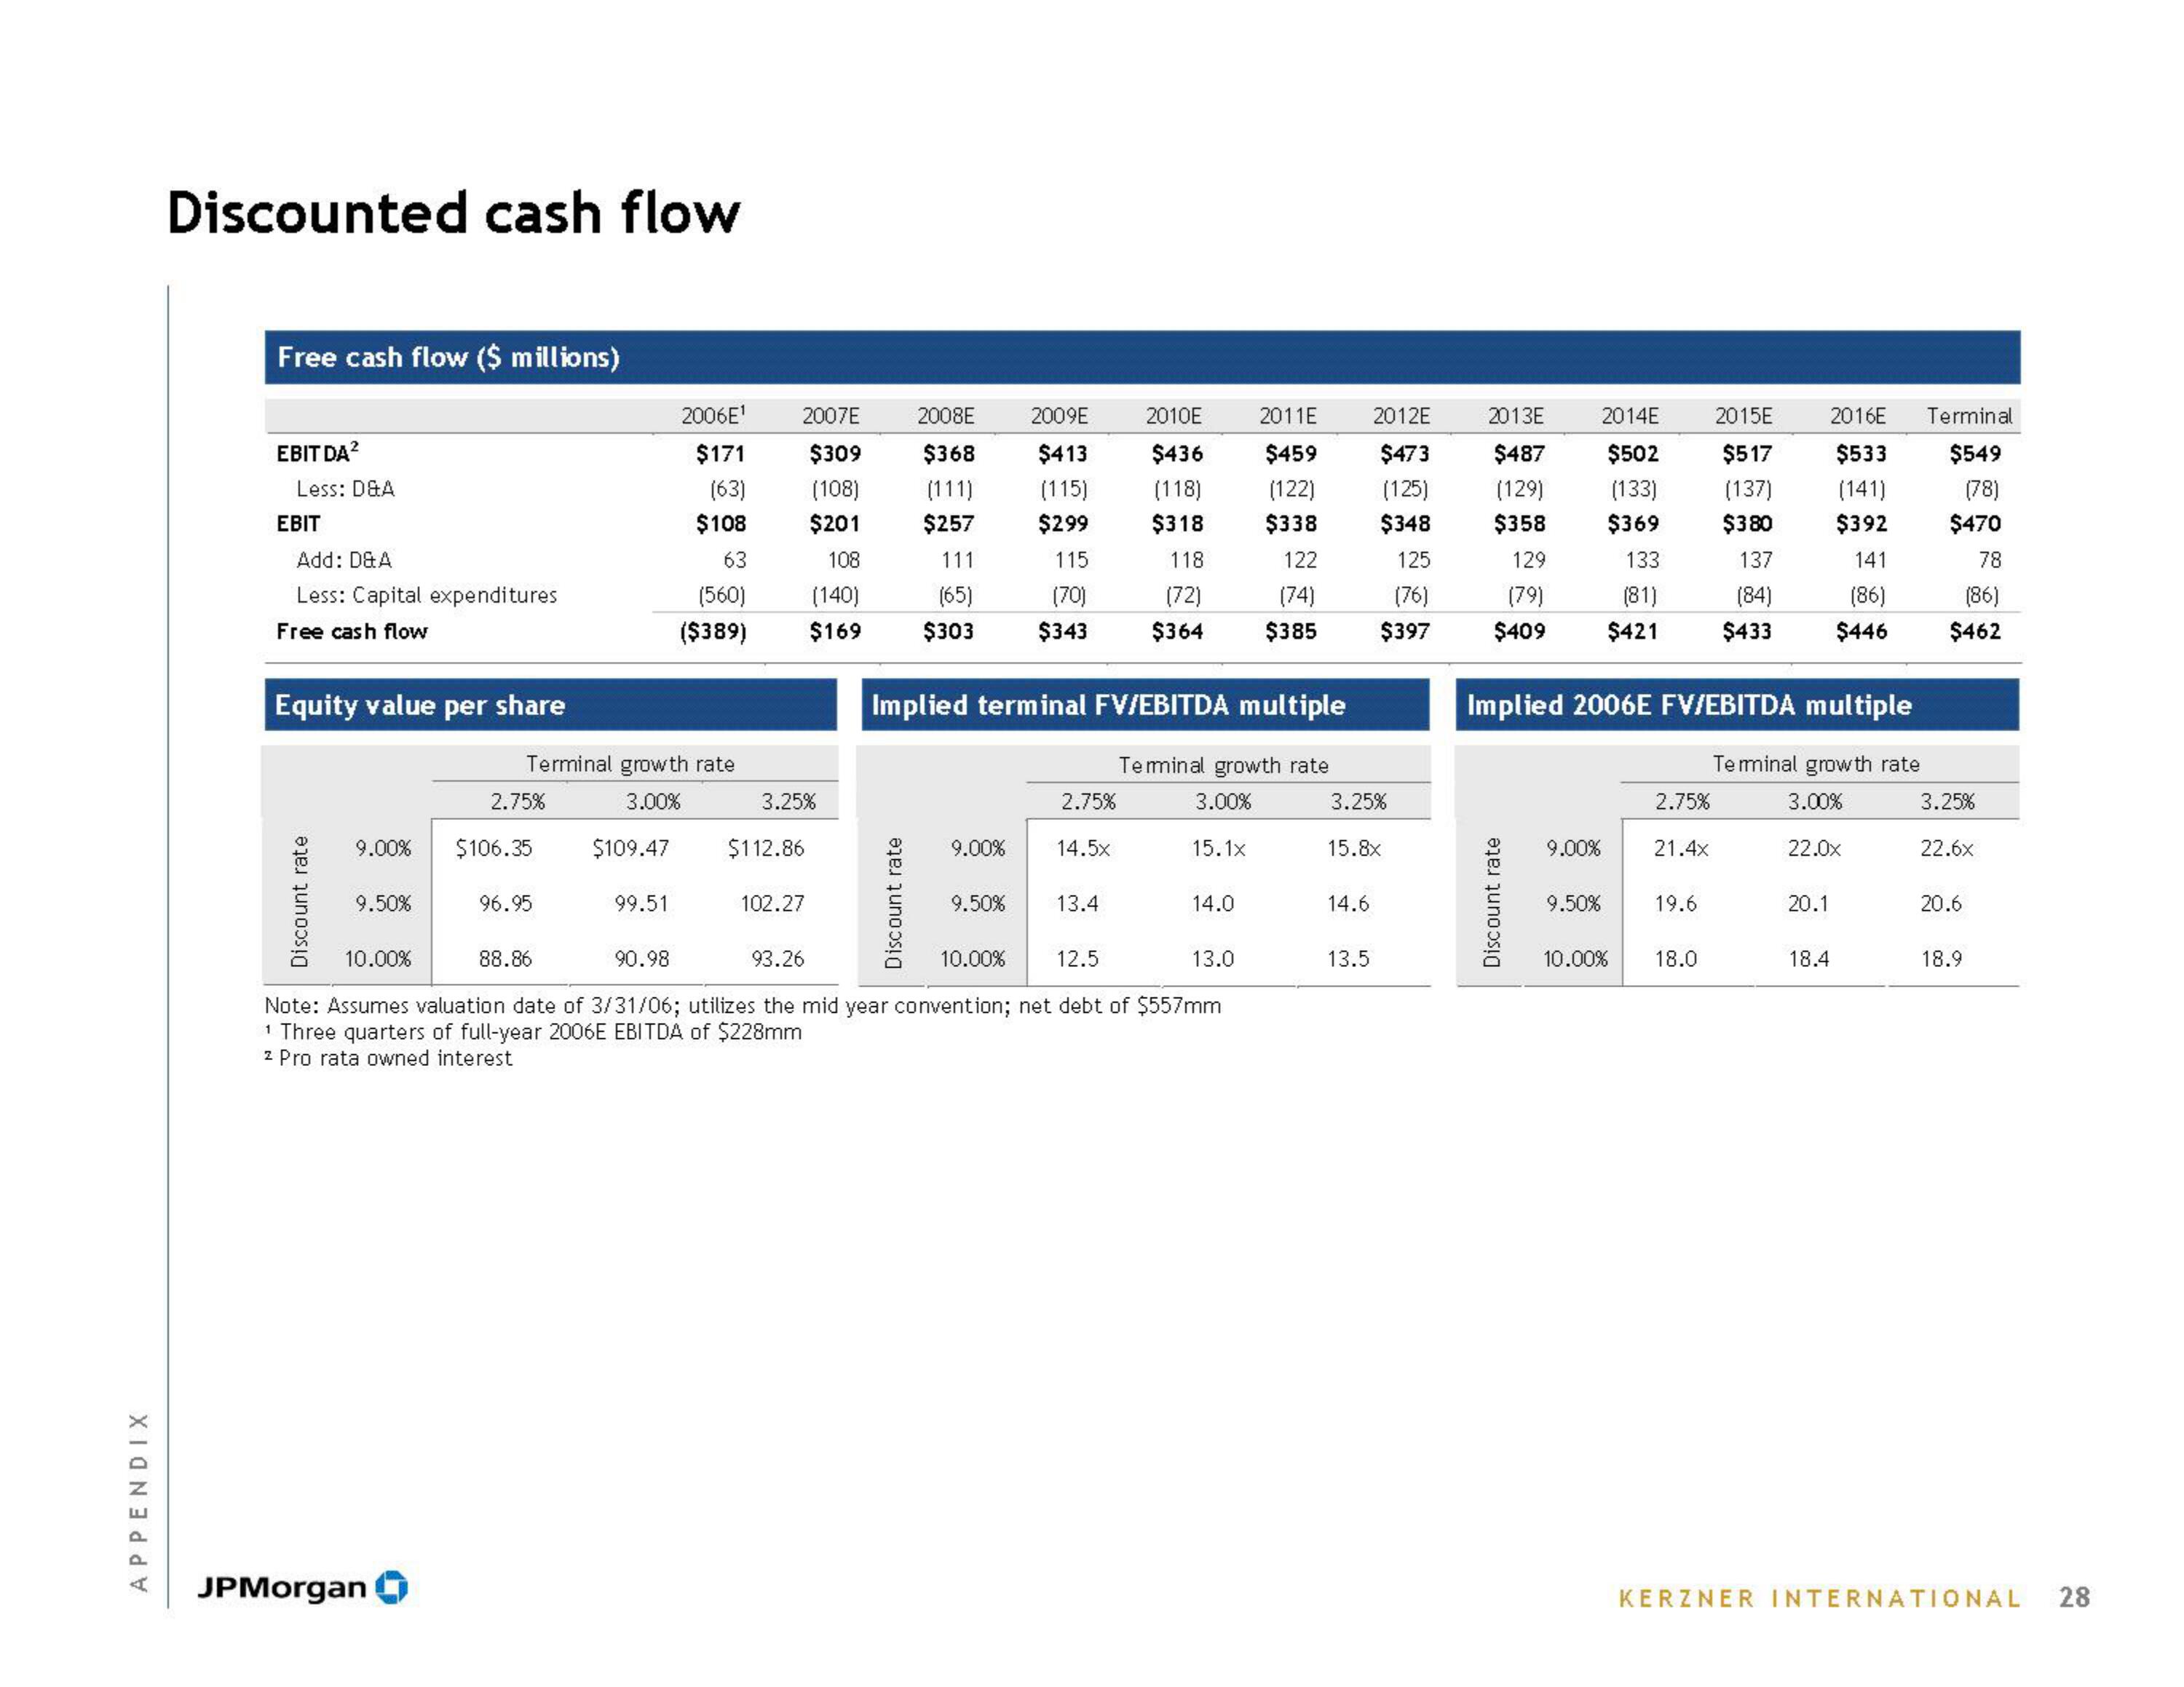
Discounted cash flow
Free cash flow ($ millions)
EBIT DA²
Less: D&A
EBIT
Add: D&A
Less: Capital expenditures
Free cash flow
Equity value per share
Discount rate
9.00%
9.50%
JPMorgan
Terminal growth rate
3.00%
2.75%
$106.35
96.95
$109.47
88.86
2006E¹
$171
(63)
$108
63
(560)
($389)
99.51
2007E
$309
(108)
$201
108
(140)
$169
3.25%
$112.86
102.27
2008E
$368
(111)
$257
111
(65)
$303
Discount rate
9.00%
2009E
$413
(115)
$299
115
(70)
$343
9.50%
Implied terminal FV/EBITDA multiple
Terminal growth rate
3.00%
2.75%
14.5×
2010E
$436
(118)
$318
118
(72)
$364
13.4
15.1x
10.00%
90.98
93.26
10.00%
12.5
Note: Assumes valuation date of 3/31/06; utilizes the mid year convention; net debt of $557mm
1 Three quarters of full-year 2006E EBITDA of $228mm
2 Pro rata owned interest
14.0
2011E
$459
(122)
$338
122
13.0
(74)
$385
3.25%
15.8x
14.6
2012E
$473
(125)
$348
125
(76)
$397
13.5
2013E
$487
(129)
$358
129
(79)
$409
Discount rate
9.00%
2014E
$502
(133)
$369
133
(81)
$421
Implied 2006E FV/EBITDA multiple
Terminal growth rate
3.00%
22.0x
9.50%
10.00%
2.75%
21.4x
19.6
2015E
$517
(137)
$380
137
(84)
$433
18.0
2016E
$533
(141)
$392
141
(86)
$446
20.1
18.4
Terminal
$549
(78)
$470
78
(86)
$462
3.25%
22.6x
20.6
18.9
KERZNER INTERNATIONAL
28View entire presentation