Kinnevik Results Presentation Deck
Intro
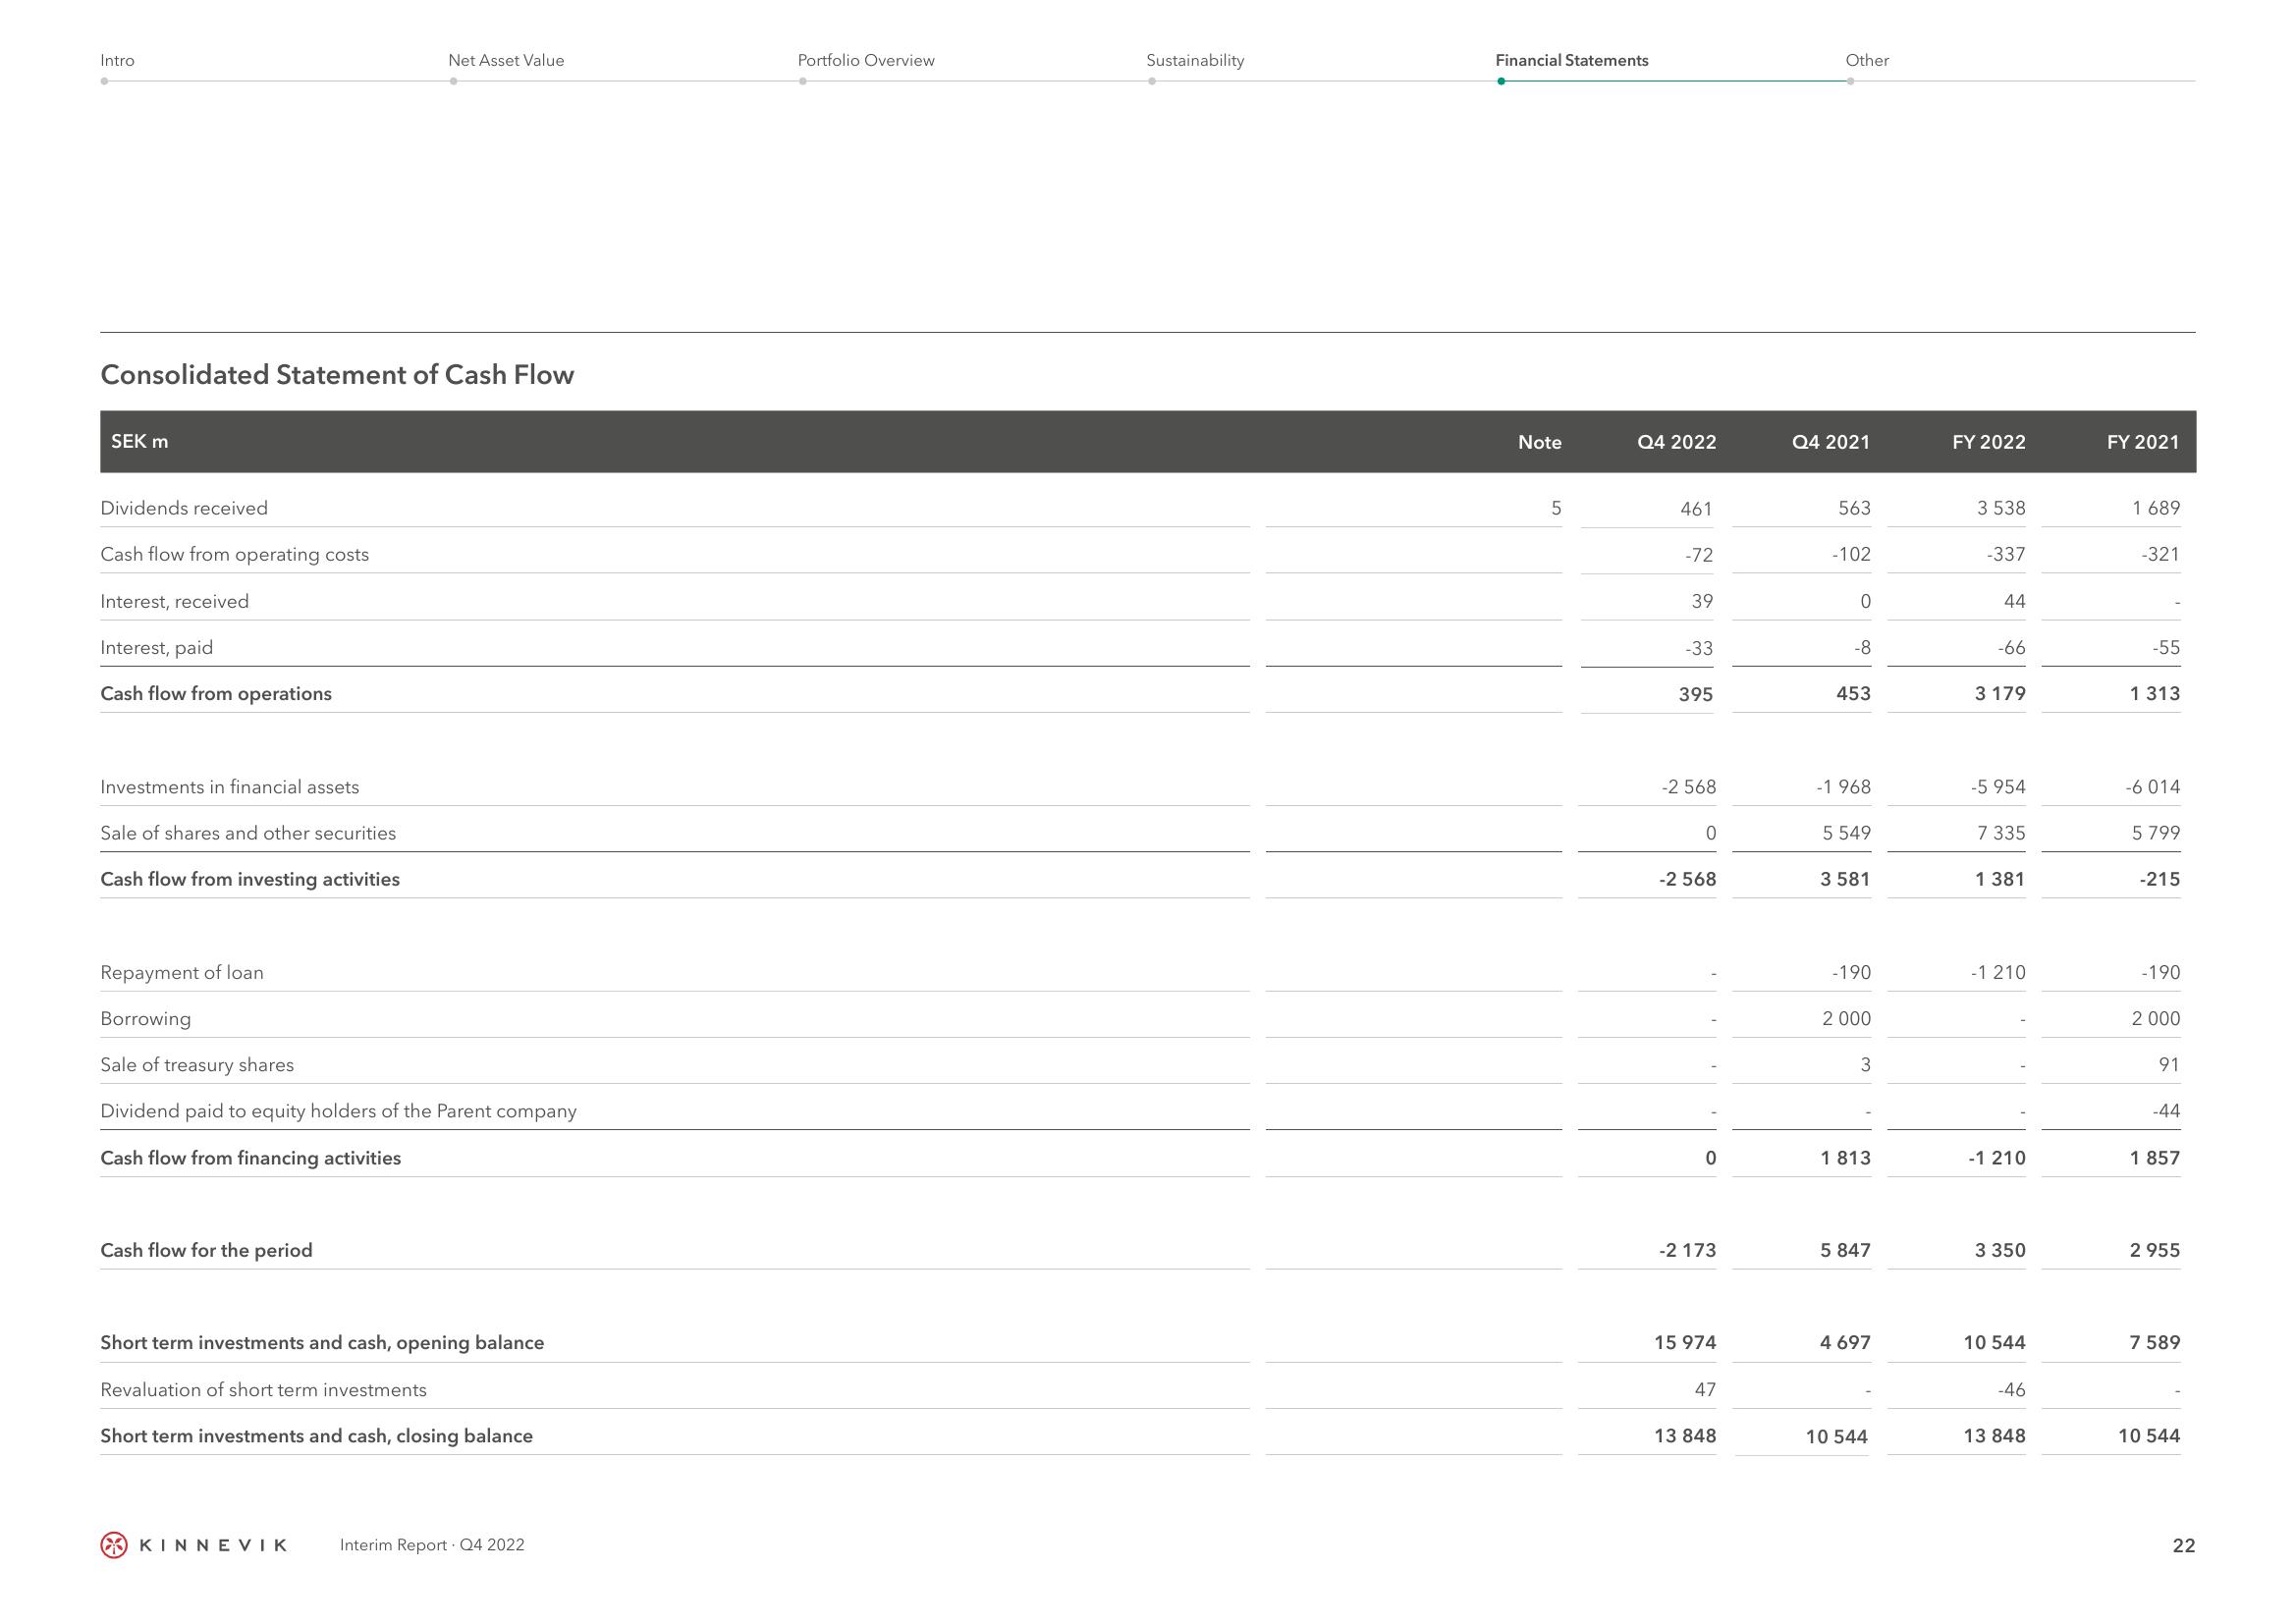
Consolidated Statement of Cash Flow
SEK m
Dividends received
Cash flow from operating costs
Interest, received
Interest, paid
Cash flow from operations
Investments in financial assets
Sale of shares and other securities
Cash flow from investing activities
Repayment of loan
Borrowing
Sale of treasury shares
Dividend paid to equity holders of the Parent company
Cash flow from financing activities
Cash flow for the period
Net Asset Value
Short term investments and cash, opening balance
Revaluation of short term investments
Short term investments and cash, closing balance
KINNEVIK
Interim Report Q4 2022
Portfolio Overview
Sustainability
Financial Statements
Note
5
Q4 2022
461
-72
39
-33
395
-2 568
0
-2 568
0
-2 173
15 974
47
13 848
Other
Q4 2021
563
-102
0
-8
453
-1 968
5 549
3 581
-190
2 000
3
1 813
5 847
4 697
10 544
FY 2022
3 538
-337
44
-66
3 179
-5 954
7 335
1 381
-1 210
-1 210
3 350
10 544
-46
13 848
FY 2021
1 689
-321
-55
1 313
-6014
5 799
-215
-190
2 000
91
-44
1 857
2 955
7 589
10 544
22View entire presentation