Bird Investor Presentation Deck
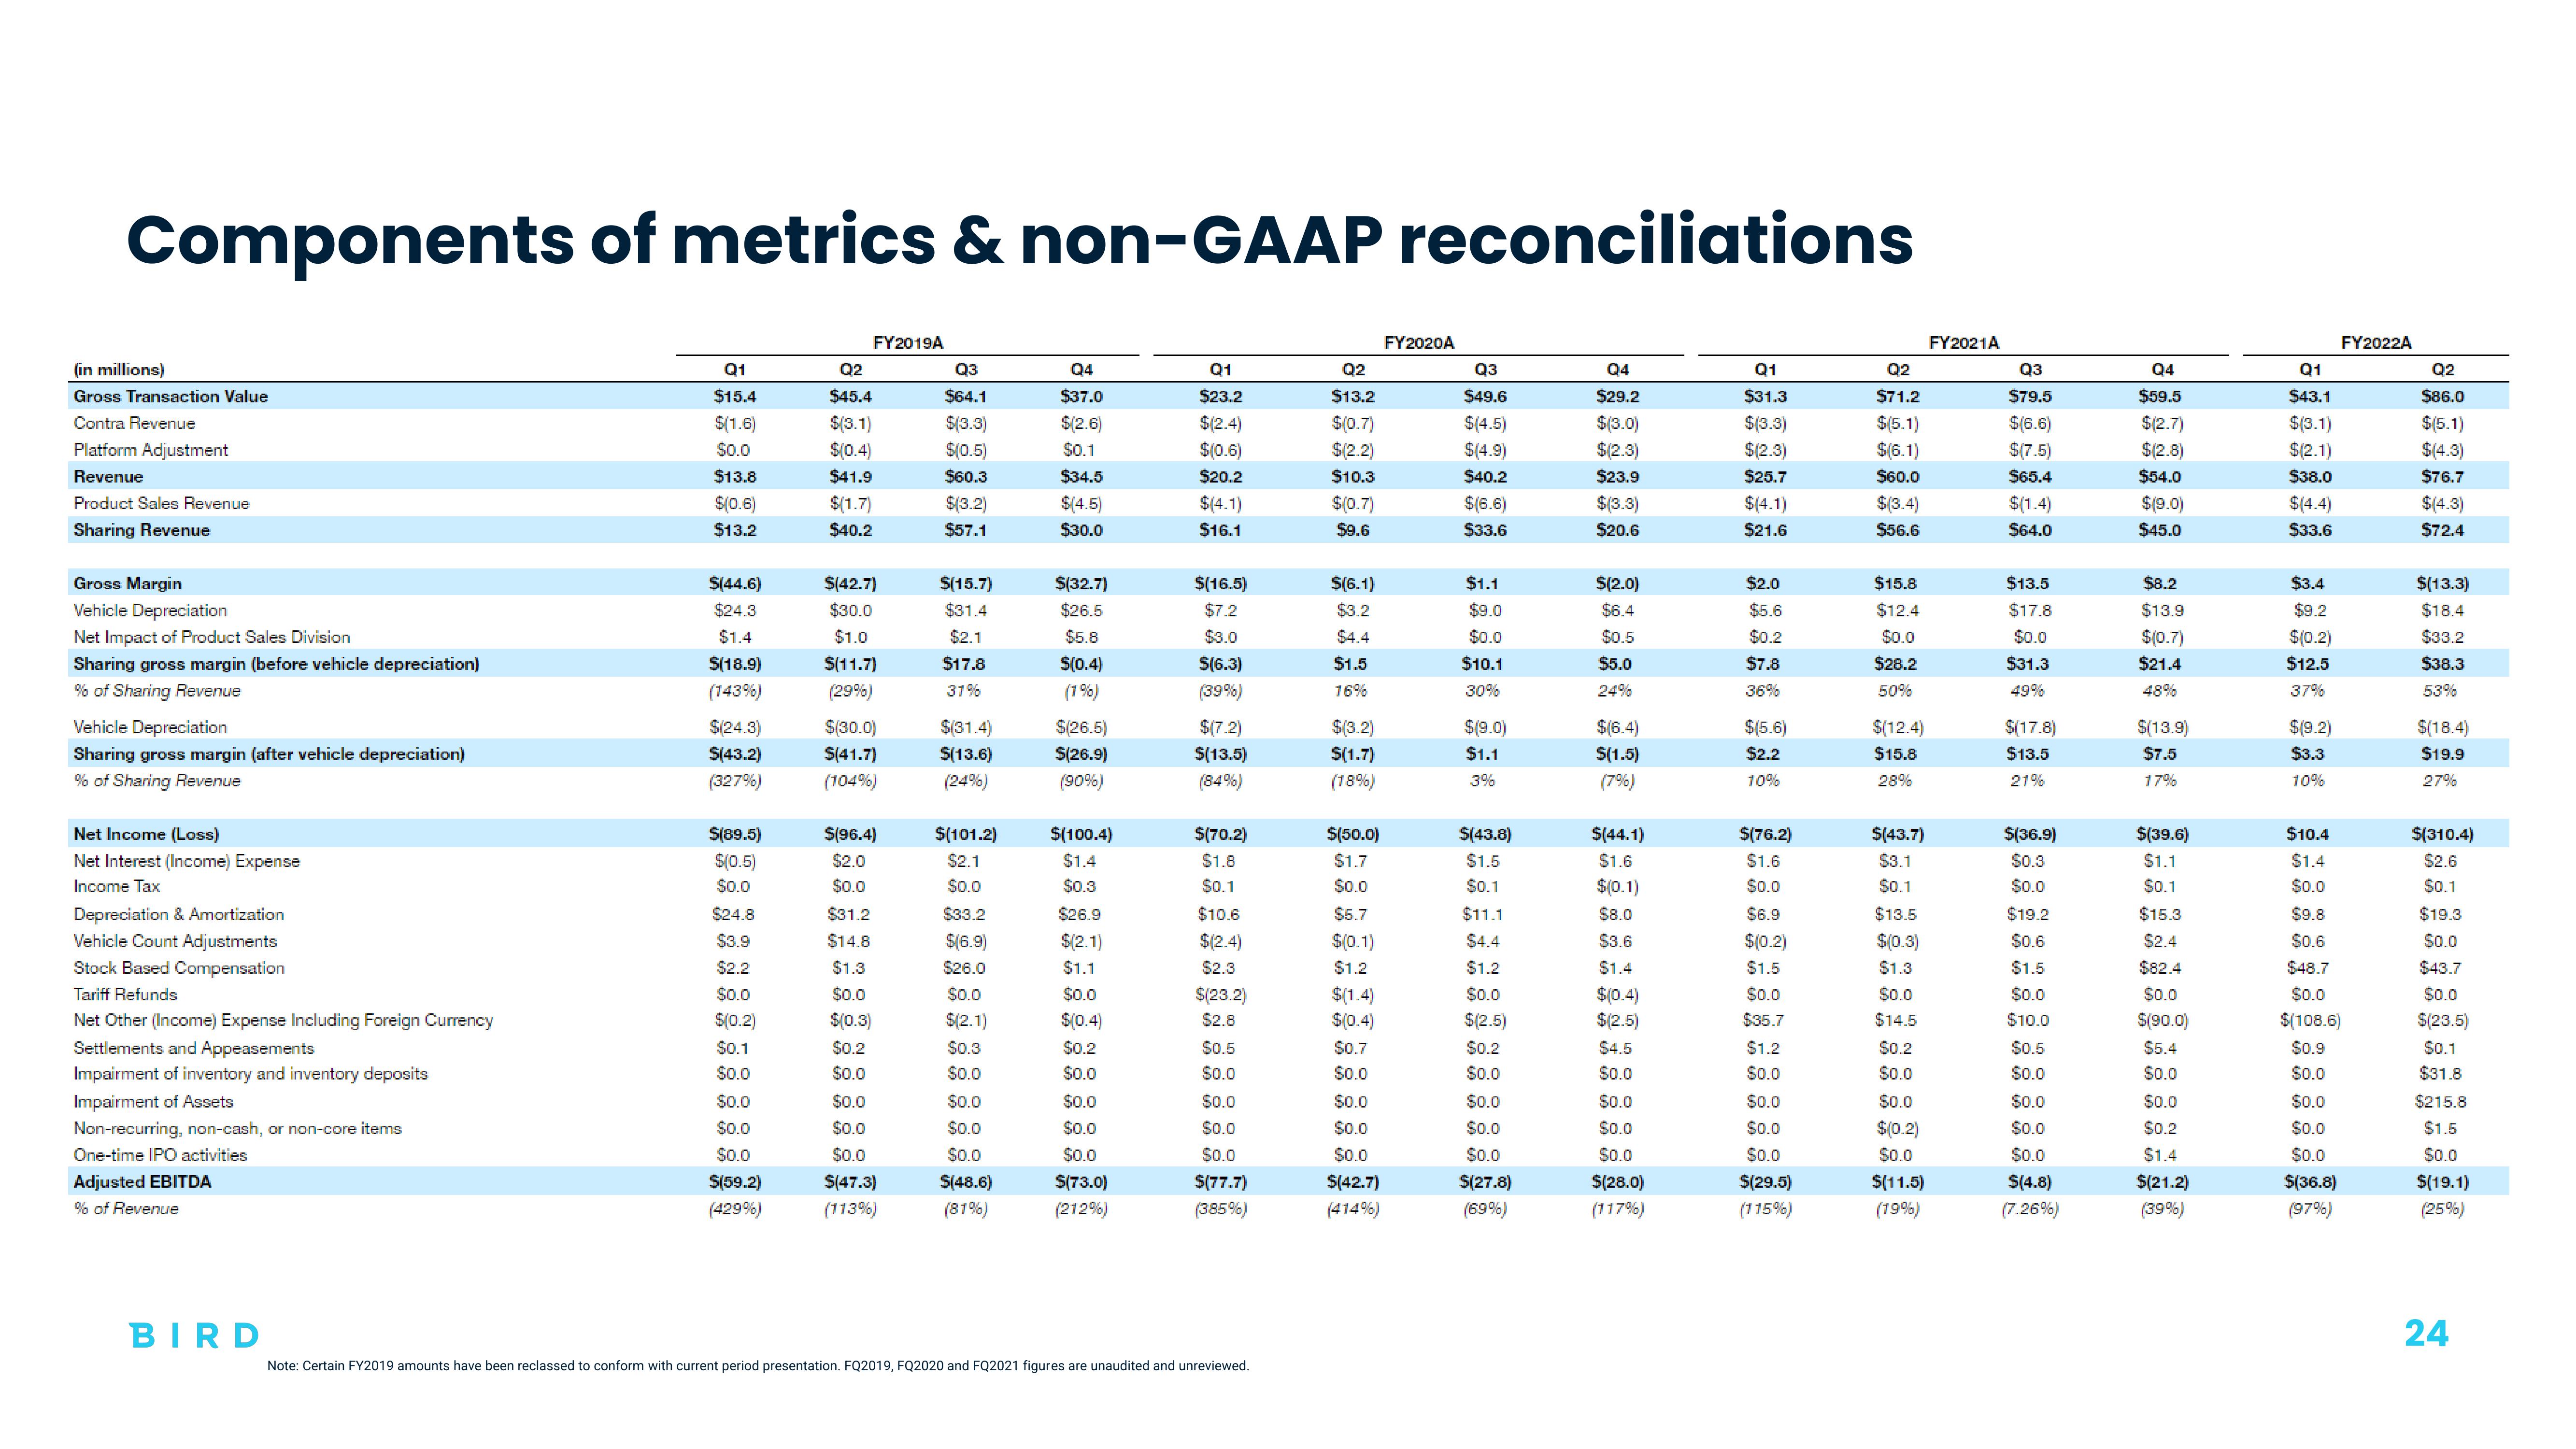
Components of metrics & non-GAAP reconciliations
(in millions)
Gross Transaction Value
Contra Revenue
Platform Adjustment
Revenue
Product Sales Revenue
Sharing Revenue
Gross Margin
Vehicle Depreciation
Net Impact of Product Sales Division
Sharing gross margin (before vehicle depreciation)
% of Sharing Revenue
Vehicle Depreciation
Sharing gross margin (after vehicle depreciation)
% of Sharing Revenue
Net Income (Loss)
Net Interest (Income) Expense
Income Tax
Depreciation & Amortization
Vehicle Count Adjustments
Stock Based Compensation
Tariff Refunds
Net Other (Income) Expense Including Foreign Currency
Settlements and Appeasements
Impairment of inventory and inventory deposits
Impairment of Assets
Non-recurring, non-cash, or non-core items
One-time IPO activities
Adjusted EBITDA
% of Revenue
BIRD
Q1
$15.4
$(1.6)
$0.0
$13.8
$(0.6)
$13.2
S(44.6)
$24.3
$1.4
$(18.9)
(143%)
$(24.3)
S(43.2)
(327%)
$(89.5)
$(0.5)
$0.0
$24.8
$3.9
$2.2
$0.0
$(0.2)
$0.1
$0.0
$0.0
$0.0
$0.0
$(59.2)
(429%)
FY2019A
Q2
$45.4
$(3.1)
$(0.4)
$41.9
$(1.7)
$40.2
$(42.7)
$30.0
$1.0
$(11.7)
(29%)
$(30.0)
S(41.7)
(104%)
$(96.4)
$2.0
$0.0
$31.2
$14.8
$1.3
$0.0
$(0.3)
$0.2
$0.0
$0.0
$0.0
$0.0
$(47.3)
(113%)
Q3
$64.1
$(3.3)
$(0.5)
$60.3
$(3.2)
$57.1
S(15.7)
$31.4
$2.1
$17.8
31%
$(31.4)
$(13.6)
(24%)
$(101.2)
$2.1
$0.0
$33.2
$(6.9)
$26.0
$0.0
$(2.1)
$0.3
$0.0
$0.0
$0.0
$0.0
S(48.6)
(81%)
Q4
$37.0
$(2.6)
$0.1
$34.5
$(4.5)
$30.0
$(32.7)
$26.5
$5.8
S(0.4)
(1%)
$(26.5)
$(26.9)
(90%)
$(100.4)
$1.4
$0.3
$26.9
$(2.1)
$1.1
$0.0
$(0.4)
$0.2
$0.0
$0.0
$0.0
$0.0
$(73.0)
(212%)
Q1
$23.2
$(2.4)
$(0.6)
$20.2
$(4.1)
$16.1
$(16.5)
$7.2
$3.0
S(6.3)
(39%)
$(7.2)
$(13.5)
(84%)
$(70.2)
$1.8
$0.1
$10.6
$(2.4)
$2.3
$(23.2)
$2.8
$0.5
$0.0
$0.0
$0.0
$0.0
$(77.7)
(385%)
Note: Certain FY2019 amounts have been reclassed to conform with current period presentation. FQ2019, FQ2020 and FQ2021 figures are unaudited and unreviewed.
Q2
$13.2
$(0.7)
$(2.2)
$10.3
$(0.7)
$9.6
$(6.1)
$3.2
$4.4
$1.5
16%
$(3.2)
$(1.7)
(18%)
$(50.0)
$1.7
$0.0
$5.7
$(0.1)
$1.2
$(1.4)
$(0.4)
$0.7
$0.0
$0.0
$0.0
$0.0
$(42.7)
(414%)
FY2020A
Q3
$49.6
$(4.5)
$(4.9)
$40.2
$(6.6)
$33.6
$1.1
$9.0
$0.0
$10.1
30%
$(9.0)
$1.1
3%
$(43.8)
$1.5
$0.1
$11.1
$4.4
$1.2
$0.0
$(2.5)
$0.2
$0.0
$0.0
$0.0
$0.0
$(27.8)
(69%)
Q4
$29.2
$(3.0)
$(2.3)
$23.9
$(3.3)
$20.6
$(2.0)
$6.4
$0.5
$5.0
24%
$(6.4)
S(1.5)
(7%)
S(44.1)
$1.6
$(0.1)
$8.0
$3.6
$1.4
$(0.4)
$(2.5)
$4.5
$0.0
$0.0
$0.0
$0.0
$(28.0)
(117%)
Q1
$31.3
$(3.3)
$(2.3)
$25.7
$(4.1)
$21.6
$2.0
$5.6
$0.2
$7.8
36%
$(5.6)
$2.2
10%
$(76.2)
$1.6
$0.0
$6.9
$(0.2)
$1.5
$0.0
$35.7
$1.2
$0.0
$0.0
$0.0
$0.0
$(29.5)
(115%)
Q2
$71.2
$(5.1)
$(6.1)
$60.0
$(3.4)
$56.6
$15.8
$12.4
$0.0
$28.2
50%
$(12.4)
$15.8
28%
$(43.7)
$3.1
$0.1
$13.5
$(0.3)
$1.3
$0.0
$14.5
$0.2
$0.0
$0.0
$(0.2)
$0.0
$(11.5)
(19%)
FY2021A
Q3
$79.5
$(6.6)
$(7.5)
$65.4
$(1.4)
$64.0
$13.5
$17.8
$0.0
$31.3
49%
$(17.8)
$13.5
21%
$(36.9)
$0.3
$0.0
$19.2
$0.6
$1.5
$0.0
$10.0
$0.5
$0.0
$0.0
$0.0
$0.0
S(4.8)
(7.26%)
Q4
$59.5
$(2.7)
$(2.8)
$54.0
$(9.0)
$45.0
$8.2
$13.9
$(0.7)
$21.4
48%
$(13.9)
$7.5
17%
$(39.6)
$1.1
$0.1
$15.3
$2.4
$82.4
$0.0
$(90.0)
$5.4
$0.0
$0.0
$0.2
$1.4
$(21.2)
(39%)
Q1
$43.1
$(3.1)
$(2.1)
$38.0
$(4.4)
$33.6
$3.4
$9.2
$(0.2)
$12.5
37%
$(9.2)
$3.3
10%
FY2022A
$10.4
$1.4
$0.0
$9.8
$0.6
$48.7
$0.0
$(108.6)
$0.9
$0.0
$0.0
$0.0
$0.0
$(36.8)
(97%)
Q2
$86.0
$(5.1)
$(4.3)
$76.7
$(4.3)
$72.4
$(13.3)
$18.4
$33.2
$38.3
53%
$(18.4)
$19.9
27%
$(310.4)
$2.6
$0.1
$19.3
$0.0
$43.7
$0.0
$(23.5)
$0.1
$31.8
$215.8
$1.5
$0.0
$(19.1)
(25%)
24View entire presentation