IGI SPAC Presentation Deck
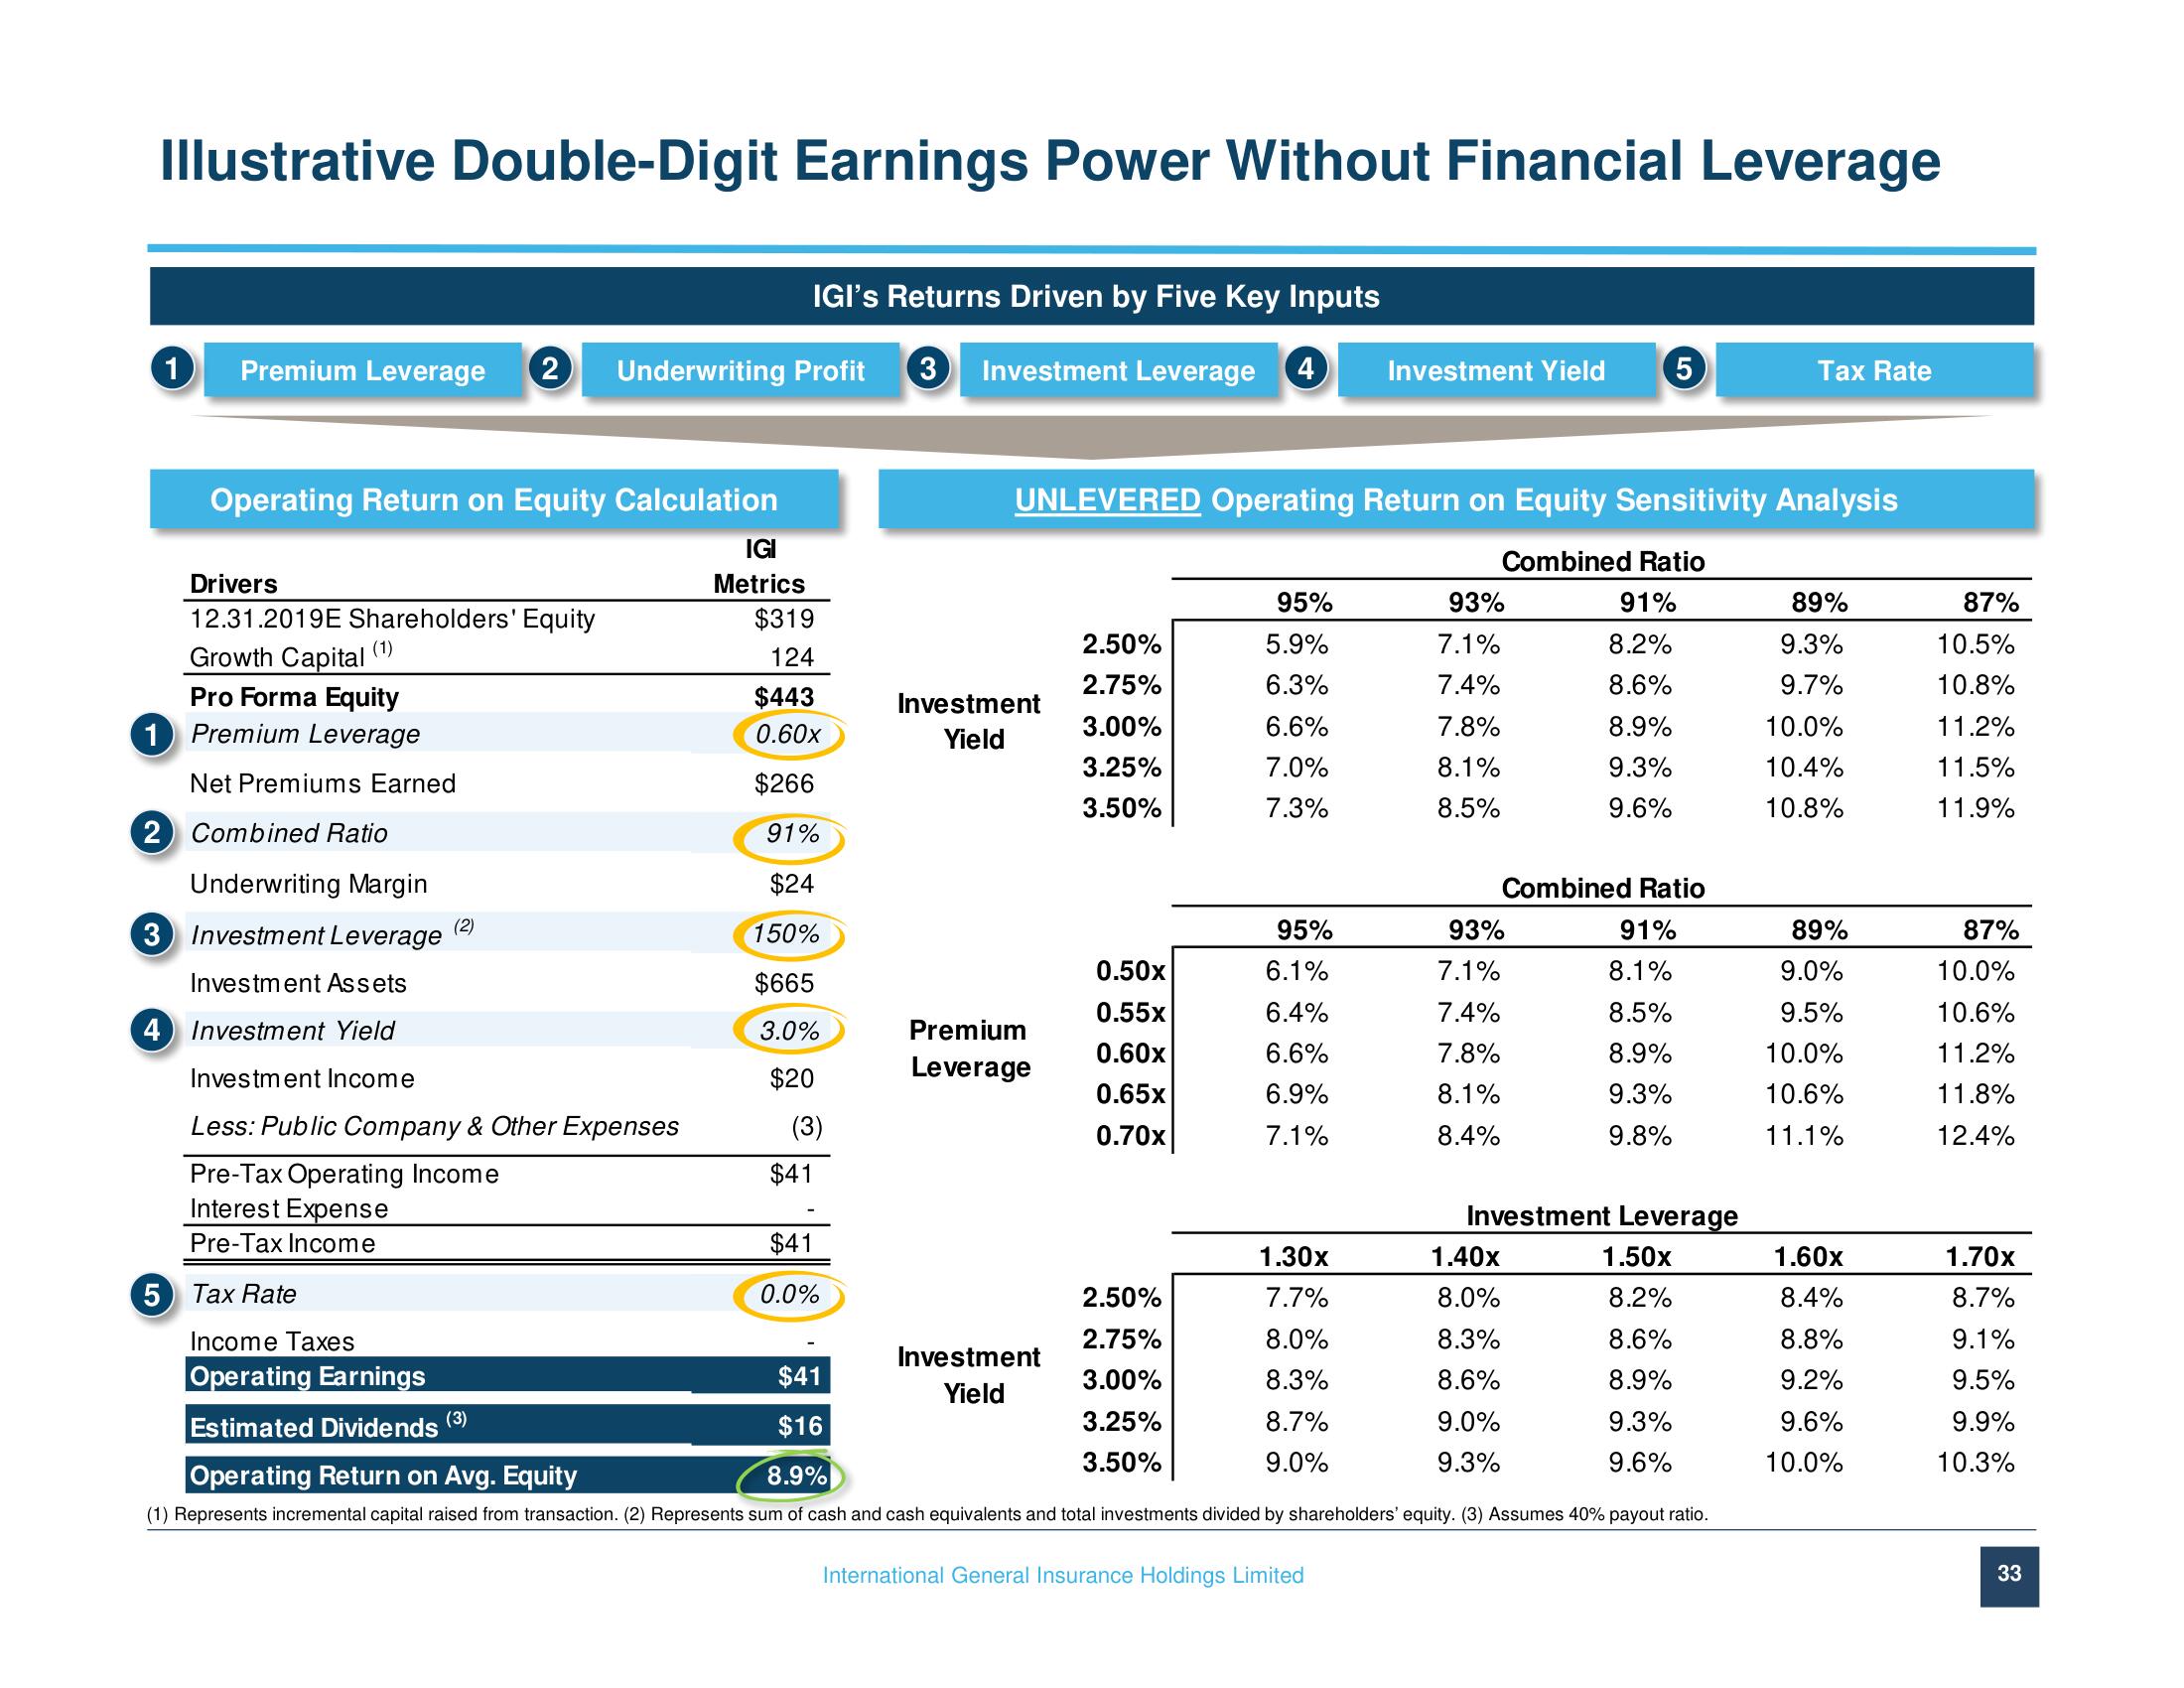
Illustrative Double-Digit Earnings Power Without Financial Leverage
1
IGI's Returns Driven by Five Key Inputs
Premium Leverage 2 Underwriting Profit 3 Investment Leverage 4
Operating Return on Equity Calculation
Drivers
12.31.2019E Shareholders' Equity
Growth Capital (1)
Pro Forma Equity
1 Premium Leverage
Net Premiums Earned
2 Combined Ratio
Underwriting Margin
3 Investment Leverage
Investment Assets
4 Investment Yield
Investment Income
(2)
Less: Public Company & Other Expenses
Pre-Tax Operating Income
Interest Expense
Pre-Tax Income
5 Tax Rate
IGI
Metrics
(3)
$319
124
$443
0.60x
$266
91%
$24
150%
$665
3.0%
$20
(3)
$41
$41
0.0%
Investment
Yield
Premium
Leverage
UNLEVERED Operating Return on Equity Sensitivity Analysis
Combined Ratio
91%
8.2%
8.6%
8.9%
9.3%
9.6%
2.50%
2.75%
3.00%
3.25%
3.50%
Investment
Yield
0.50x
0.55x
0.60x
0.65x
0.70x
2.50%
2.75%
3.00%
3.25%
3.50%
95%
5.9%
6.3%
6.6%
7.0%
7.3%
95%
6.1%
6.4%
6.6%
6.9%
7.1%
1.30x
7.7%
8.0%
8.3%
Investment Yield
8.7%
9.0%
International General Insurance Holdings Limited
93%
7.1%
7.4%
7.8%
8.1%
8.5%
5
93%
7.1%
7.4%
7.8%
8.1%
8.4%
Income Taxes
Operating Earnings
$41
Estimated Dividends
$16
8.9%
Operating Return on Avg. Equity
(1) Represents incremental capital raised from transaction. (2) Represents sum of cash and cash equivalents and total investments divided by shareholders' equity. (3) Assumes 40% payout ratio.
Combined Ratio
91%
8.1%
8.5%
8.9%
9.3%
9.8%
1.40x
8.0%
8.3%
8.6%
9.0%
9.3%
Investment Leverage
1.50x
8.2%
8.6%
8.9%
9.3%
9.6%
Tax Rate
89%
9.3%
9.7%
10.0%
10.4%
10.8%
89%
9.0%
9.5%
10.0%
10.6%
11.1%
1.60x
8.4%
8.8%
9.2%
9.6%
10.0%
87%
10.5%
10.8%
11.2%
11.5%
11.9%
87%
10.0%
10.6%
11.2%
11.8%
12.4%
1.70x
8.7%
9.1%
9.5%
9.9%
10.3%
33View entire presentation