Wix Results Presentation Deck
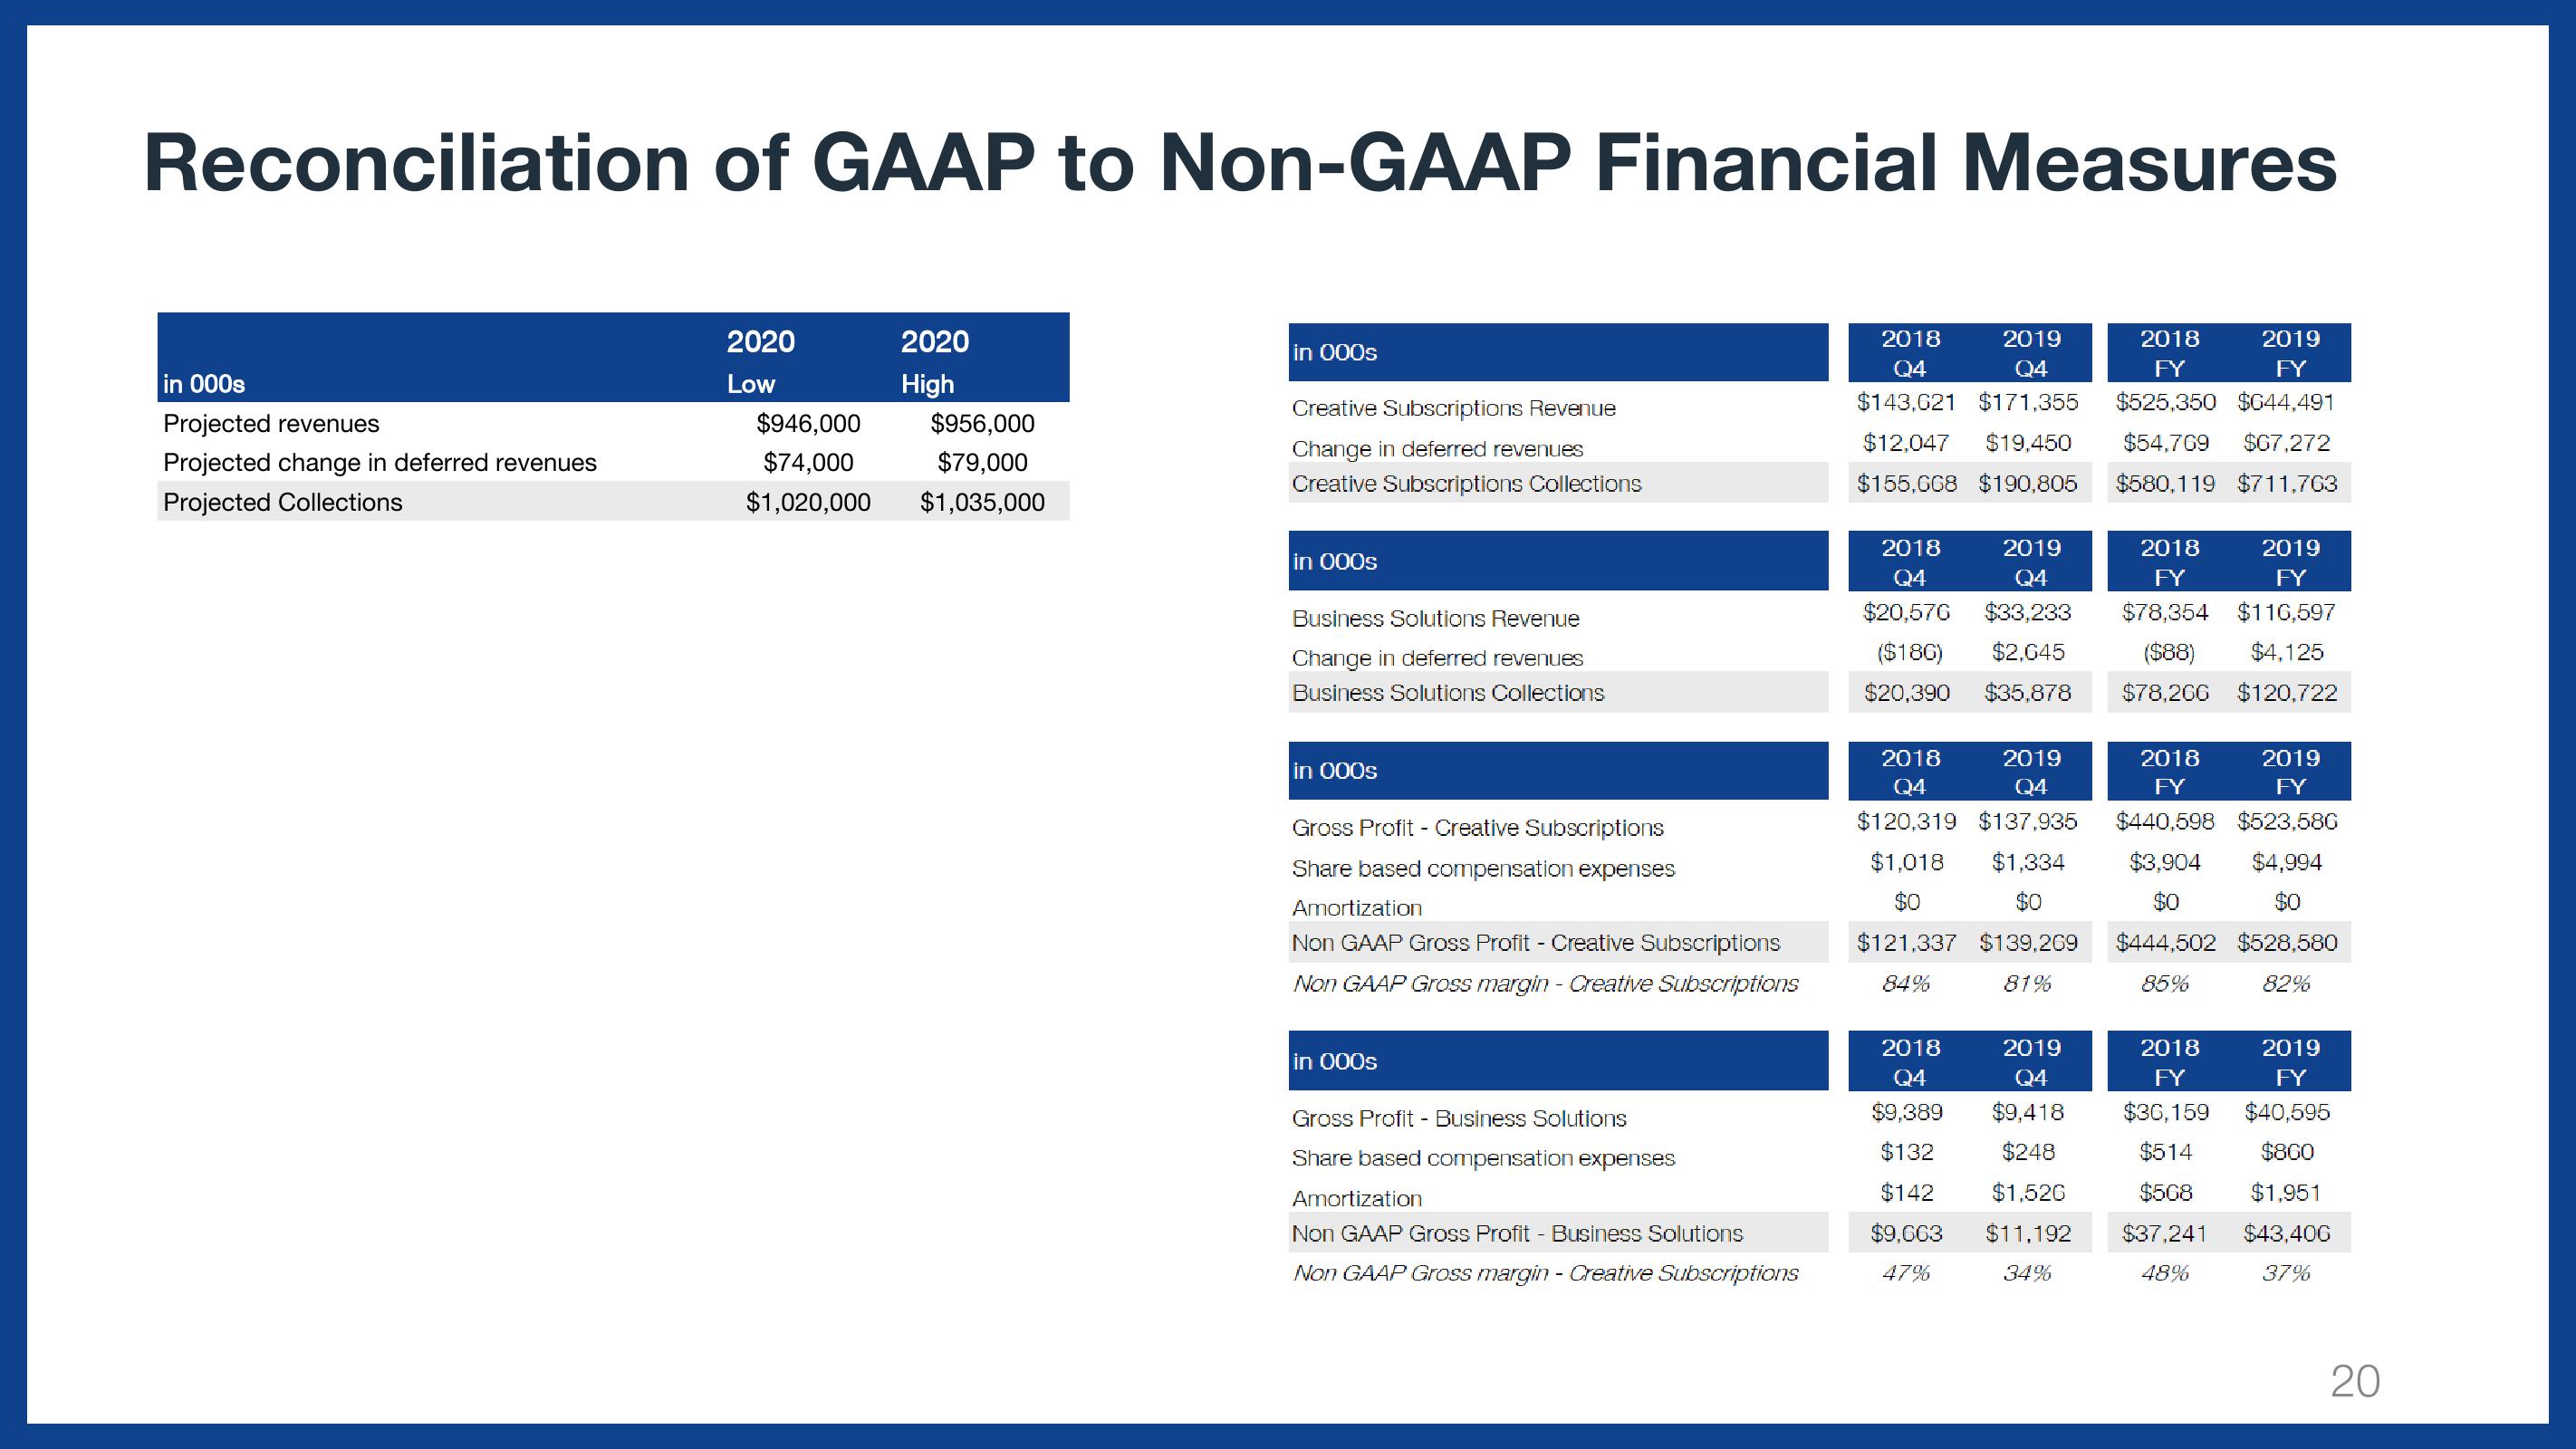
Reconciliation of GAAP to Non-GAAP Financial Measures
in 000s
Projected revenues
Projected change in deferred revenues
Projected Collections
2020
Low
2020
High
$946,000 $956,000
$74,000
$79,000
$1,020,000 $1,035,000
in 000s
Creative Subscriptions Revenue
Change in deferred revenues
Creative Subscriptions Collections
in 000s
Business Solutions Revenue
Change in deferred revenues
Business Solutions Collections
in 000s
Gross Profit - Creative Subscriptions
Share based compensation expenses
Amortization
Non GAAP Gross Profit - Creative Subscriptions
Non GAAP Gross margin - Creative Subscriptions
in 000s
Gross Profit - Business Solutions
Share based compensation expenses
Amortization
Non GAAP Gross Profit - Business Solutions
Non GAAP Gross margin - Creative Subscriptions
2018
2019
Q4
Q4
$143,621 $171,355
$12,047 $19.450
$155,668 $190,805
2018
Q4
$20,576
($186)
$20,390
2018
2019
FY
FY
$525,350 $644.491
$54,769 $67,272
$580,119 $711,763
2018
Q4
$9,389
$132
$142
$9,603
47%
2019
2018
Q4
FY
$33,233 $78,354
$2,645 ($88)
$35,878 $78,266
2018 2019
2018 2019
Q4
Q4
FY
FY
$120,319 $137,935 $440,598 $523,586
$1,018 $1,334 $3,904 $4,994
$0
$0
$0
$0
$121,337 $139,269 $444,502 $528,580
84%
81%
85%
82%
2019
FY
$116,597
$4,125
$120,722
2019
2018
Q4
FY
$9,418 $36,159
$248
$514
$1,526
$568
$11.192 $37,241
34%
48%
2019
FY
$40,595
$860
$1,951
$43,406
37%
20View entire presentation