Allwyn Results Presentation Deck
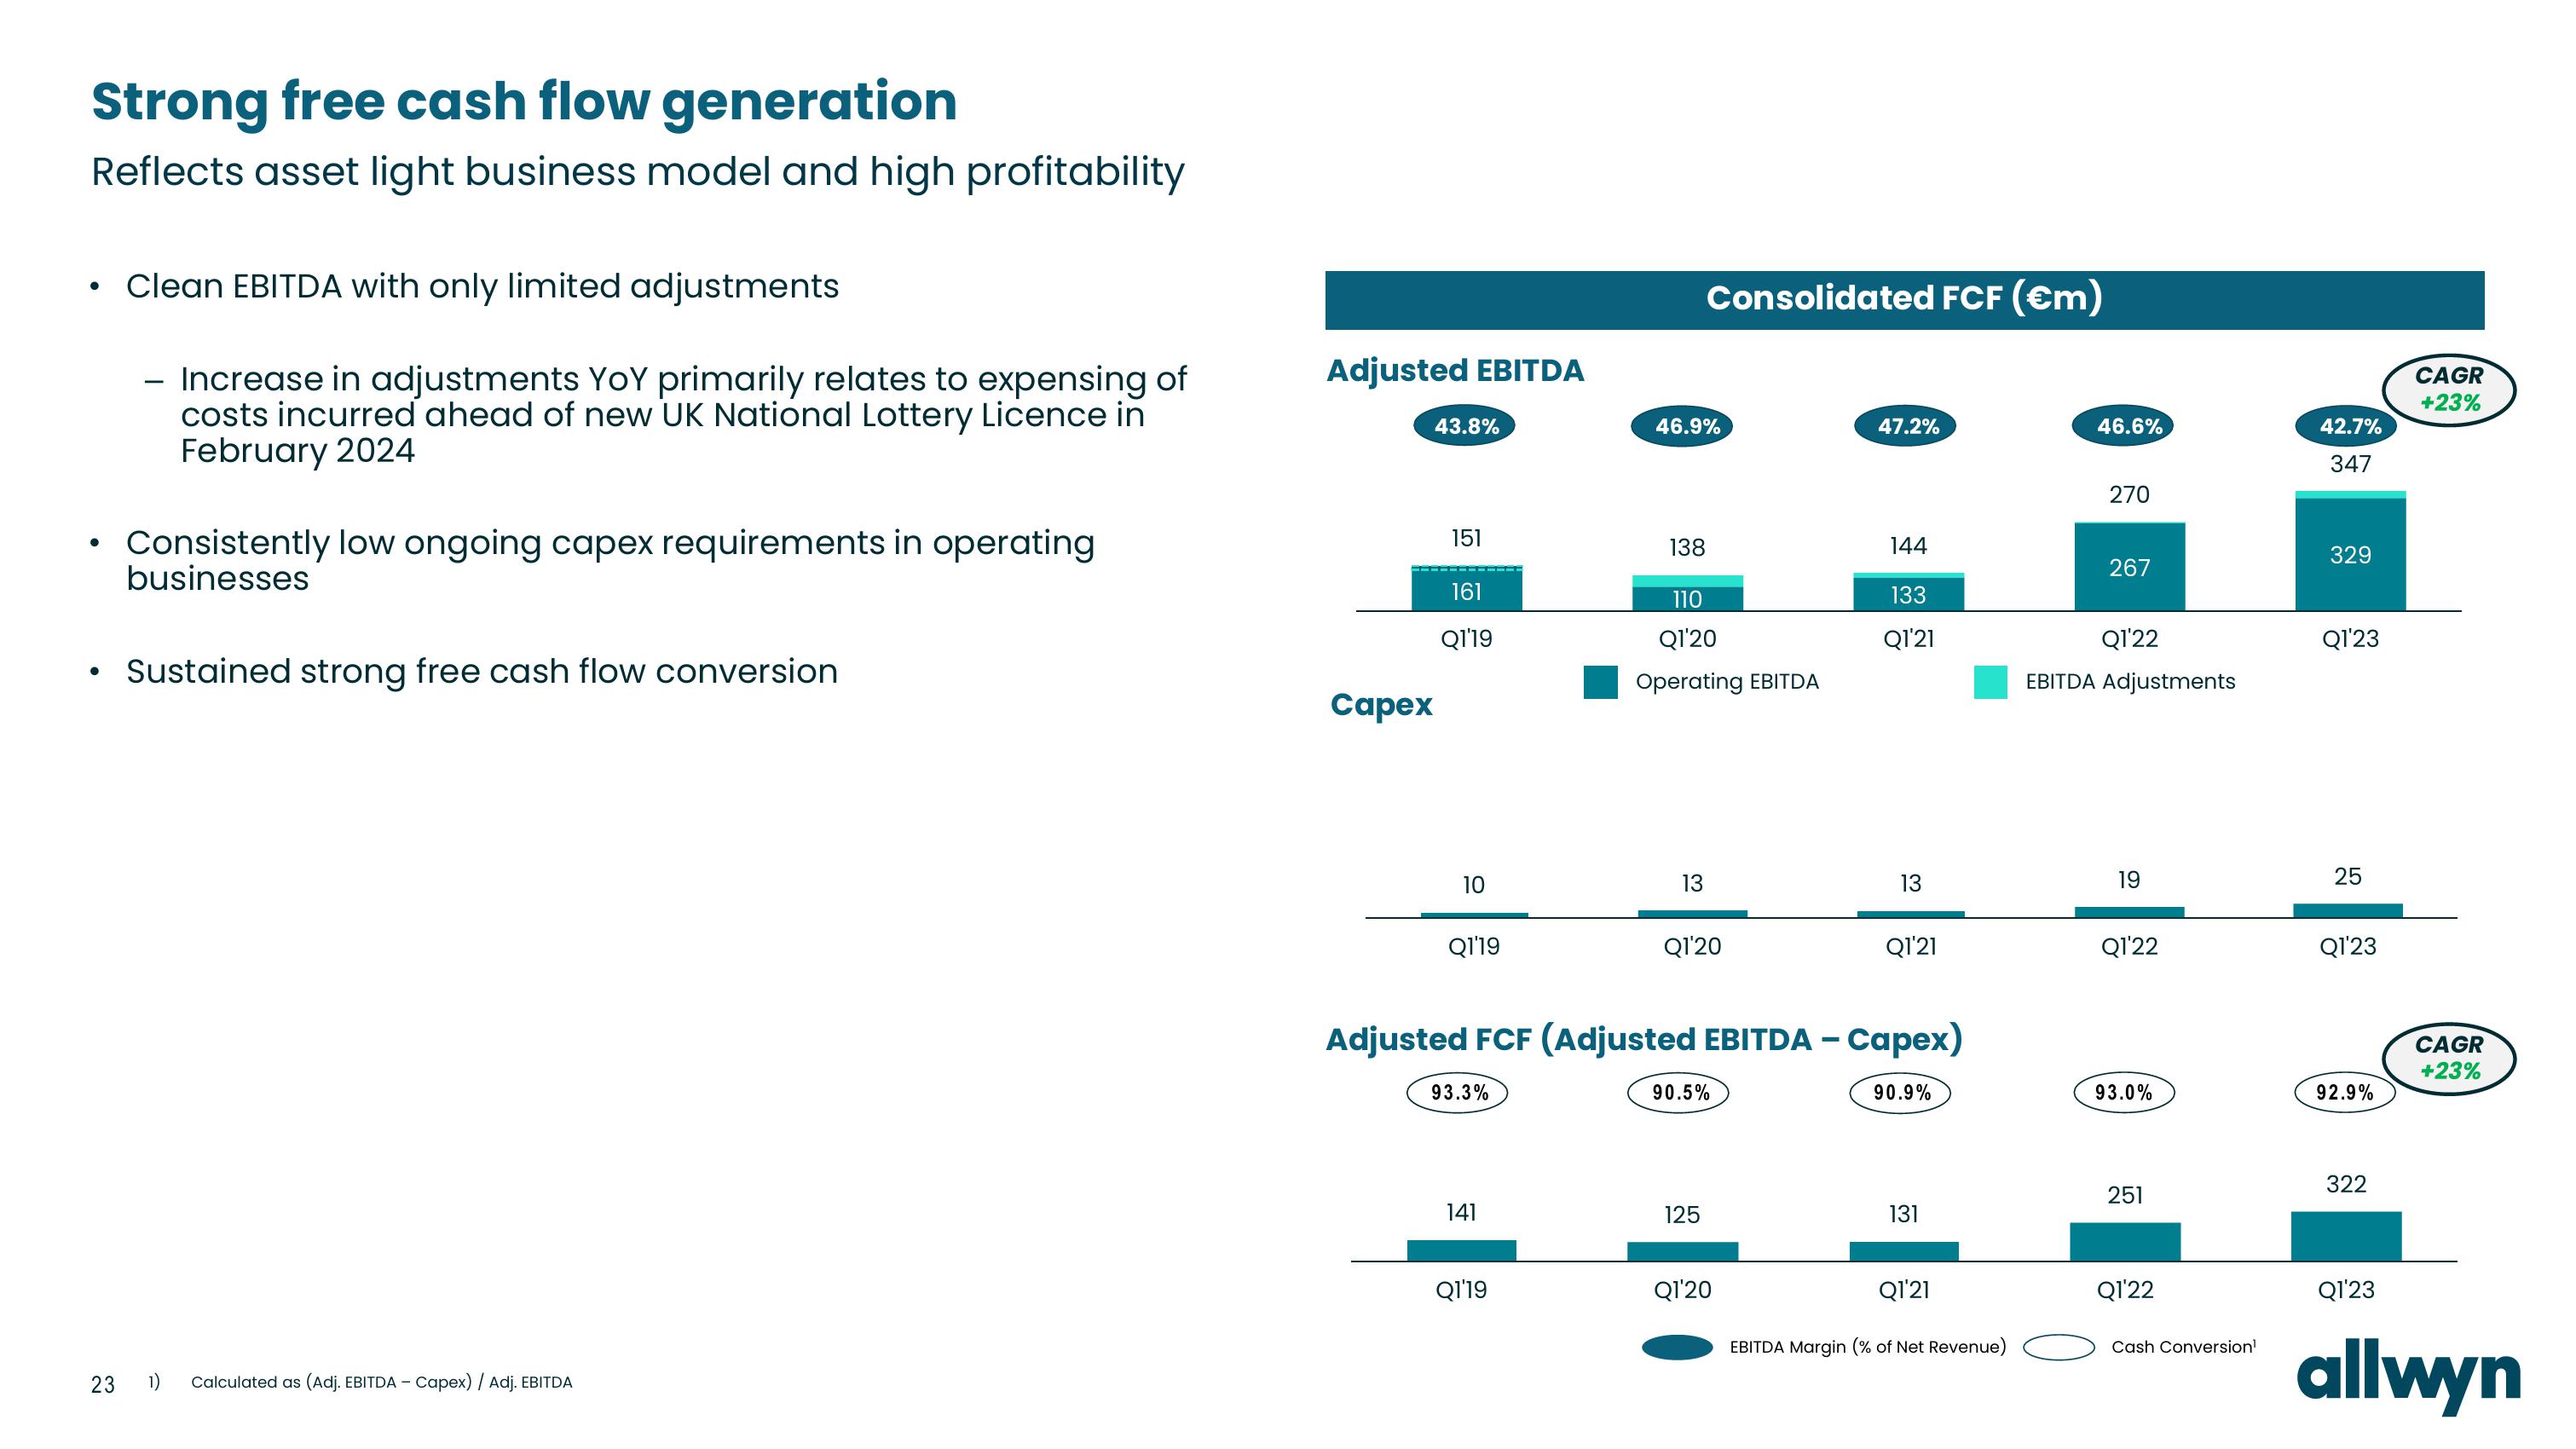
Strong free cash flow generation
Reflects asset light business model and high profitability
●
●
●
Clean EBITDA with only limited adjustments
- Increase in adjustments YoY primarily relates to expensing of
costs incurred ahead of new UK National Lottery Licence in
February 2024
Consistently low ongoing capex requirements in operating
businesses
Sustained strong free cash flow conversion
23 1)
Calculated as (Adj. EBITDA - Capex) / Adj. EBITDA
Adjusted EBITDA
43.8%
Capex
151
161
Q1'19
10
Q1'19
93.3%
141
Q1'19
46.9%
138
Consolidated FCF (€m)
110
Q1'20
Operating EBITDA
13
Q1'20
Adjusted FCF (Adjusted EBITDA - Capex)
90.9%
90.5%
125
47.2%
Q1'20
144
133
Q1'21
13
Q1'21
131
Q1'21
EBITDA Margin (% of Net Revenue)
46.6%
270
267
Q1'22
EBITDA Adjustments
19
Q1'22
93.0%
251
Q1'22
Cash Conversion¹
42.7%
347
329
Q1'23
25
Q1'23
92.9%
322
Q1'23
CAGR
+23%
CAGR
+23%
allwynView entire presentation