Zegna Results Presentation Deck
FY 2021 PROFITABILITY & CASH: DYNAMIC PROGRESS
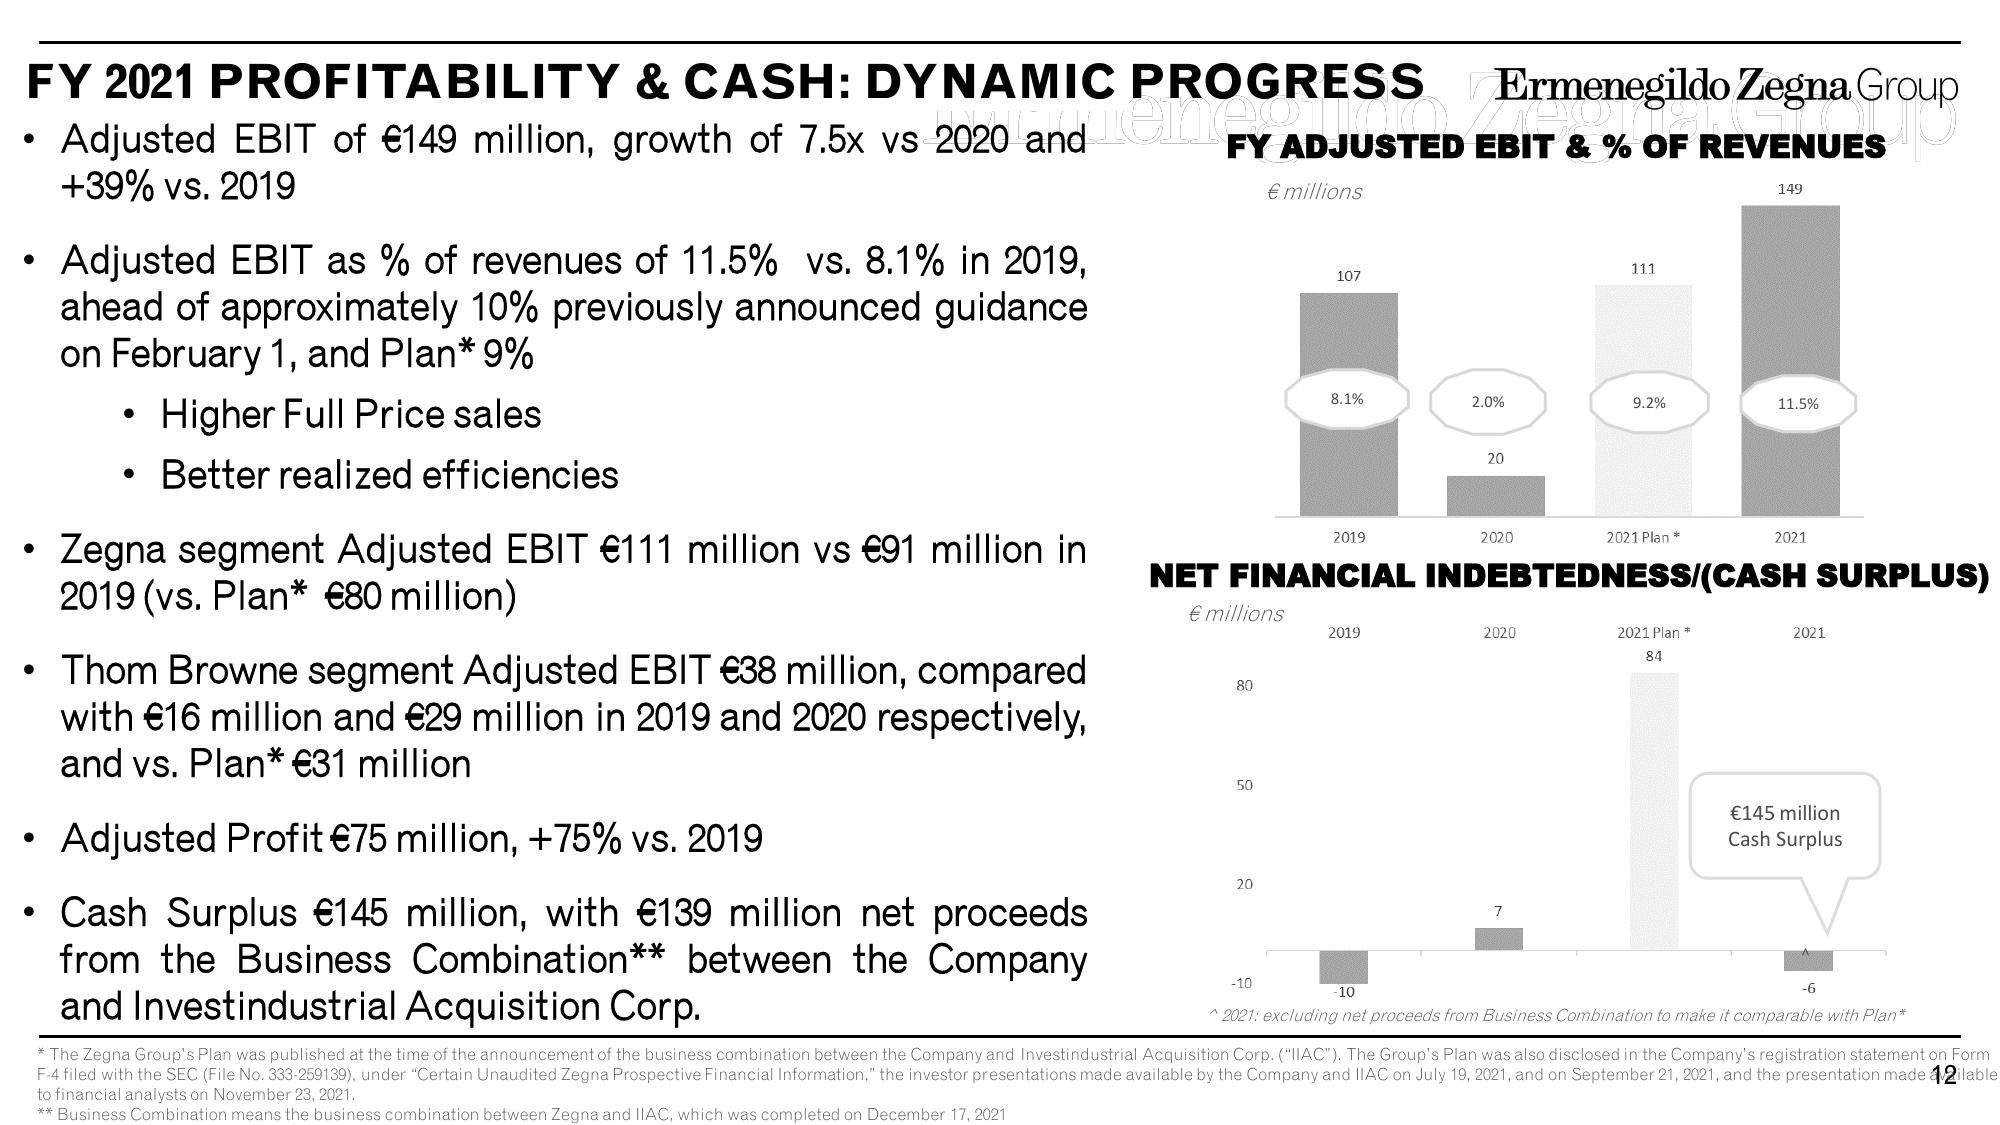
Adjusted EBIT of €149 million, growth of 7.5x vs 2020 and cont
+39% vs. 2019
Adjusted EBIT as % of revenues of 11.5% vs. 8.1% in 2019,
ahead of approximately 10% previously announced guidance
on February 1, and Plan* 9%
• Higher Full Price sales
Better realized efficiencies
●
Zegna segment Adjusted EBIT €111 million vs €91 million in
2019 (vs. Plan* €80 million)
Thom Browne segment Adjusted EBIT €38 million, compared
with €16 million and €29 million in 2019 and 2020 respectively,
and vs. Plan* €31 million
Adjusted Profit €75 million, +75% vs. 2019
• Cash Surplus €145 million, with €139 million net proceeds
from the Business Combination** between the Company
and Investindustrial Acquisition Corp.
FY ADJUSTED EBIT & % OF REVENUES
€ millions
80
50
20
107
-10
8.1%
2019
Ermenegildo Zegna Group
Dongh
2019
2.0%
20
2020
2021 Plan *
NET FINANCIAL INDEBTEDNESS/(CASH SURPLUS)
€ millions
2020
111
7
9.2%
149
2021 Plan *
84
11.5%
2021
2021
€145 million.
Cash Surplus
-6
-10
^2021: excluding net proceeds from Business Combination to make it comparable with Plan*
* The Zegna Group's Plan was published at the time of the announcement of the business combination between the Company and Investindustrial Acquisition Corp. ("IIAC"). The Group's Plan was also disclosed in the Company's registration statement on Form
F-4 filed with the SEC (File No. 333-259139), under "Certain Unaudited Zegna Prospective Financial Information," the investor presentations made available by the Company and IIAC on July 19, 2021, and on September 21, 2021, and the presentation made 12ilable.
to financial analysts on November 23, 2021.
** Business Combination means the business combination between Zegna and IIAC, which was completed on December 17, 2021View entire presentation