flyExclusive SPAC Presentation Deck
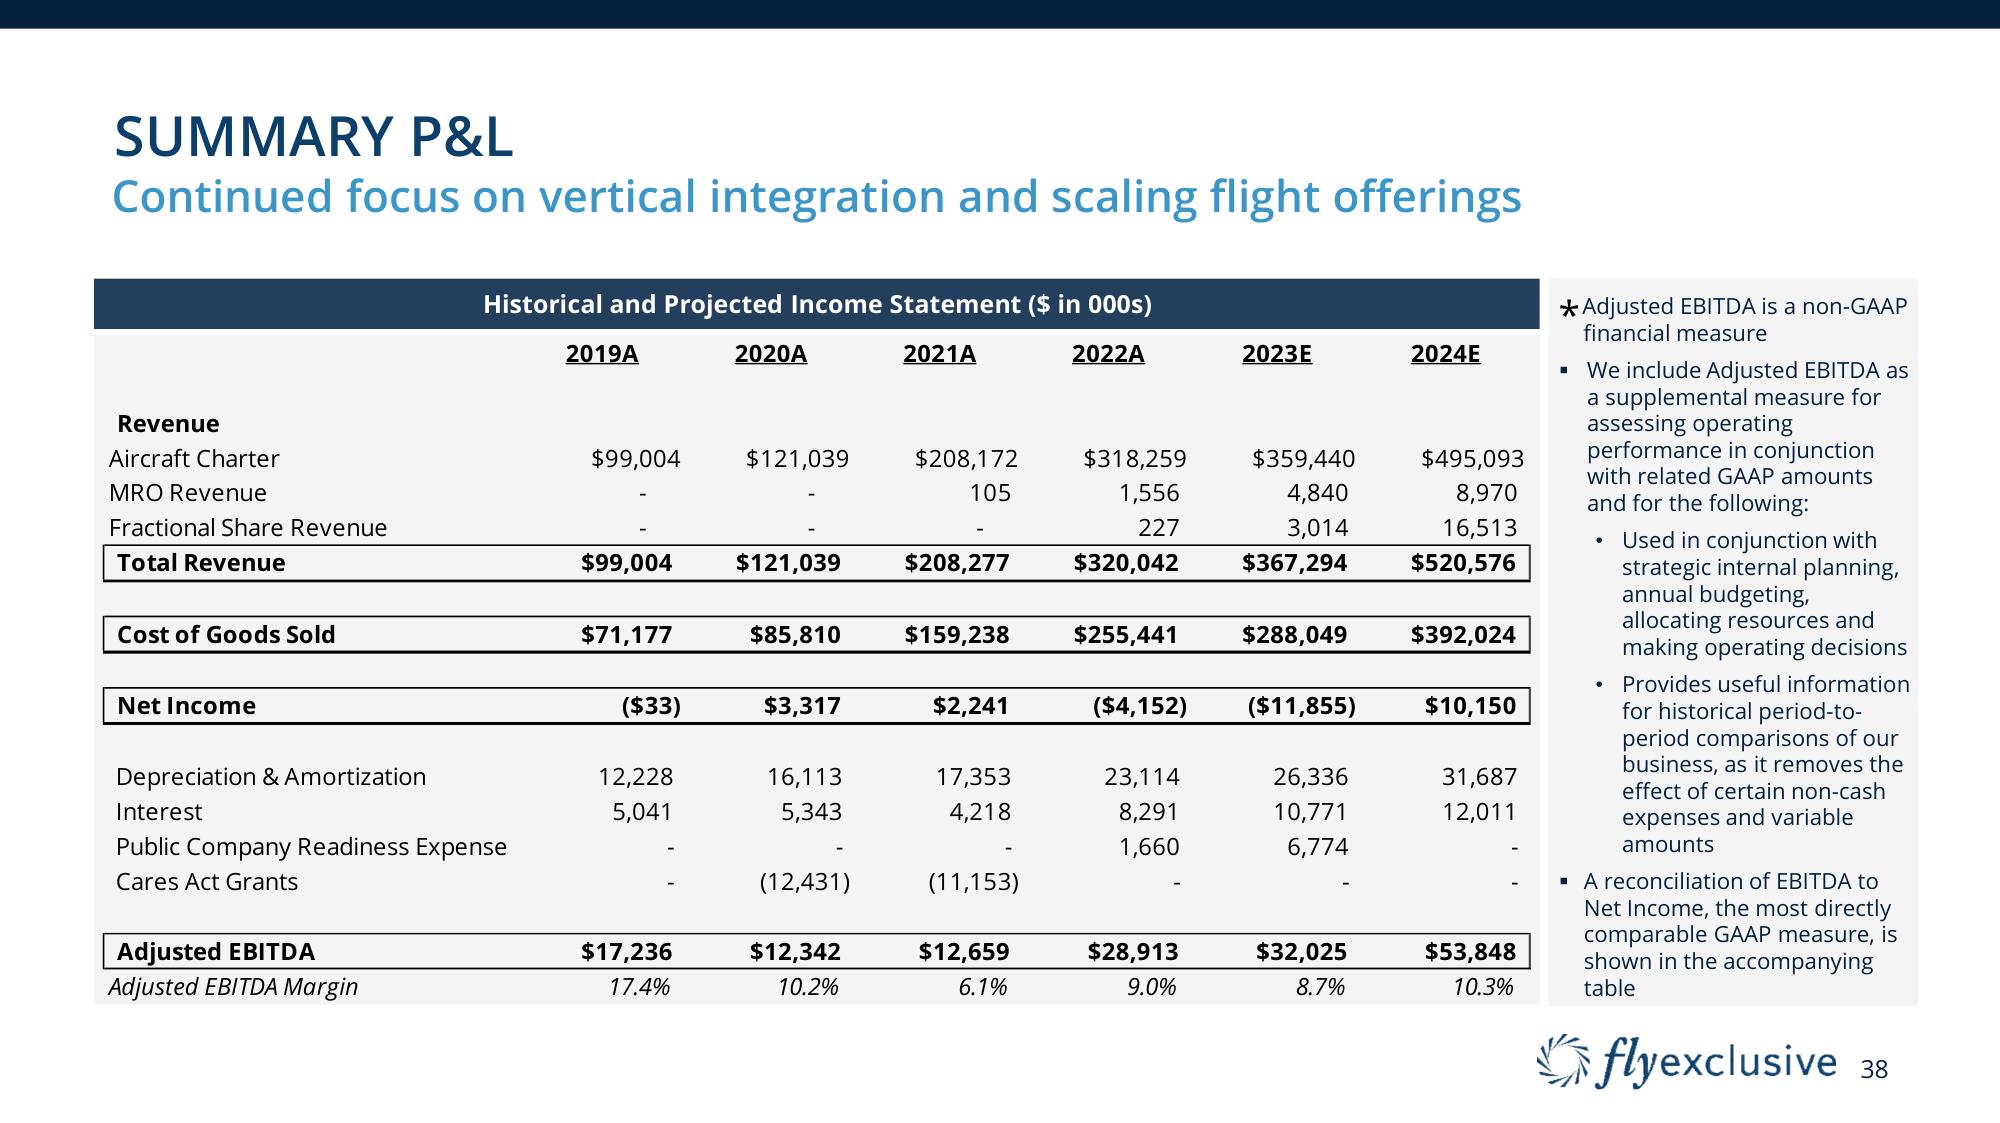
SUMMARY P&L
Continued focus on vertical integration and scaling flight offerings
Revenue
Aircraft Charter
MRO Revenue
Fractional Share Revenue
Total Revenue
Cost of Goods Sold
Net Income
Historical and Projected Income Statement ($ in 000s)
2021A
2022A
Depreciation & Amortization
Interest
Public Company Readiness Expense
Cares Act Grants
Adjusted EBITDA
Adjusted EBITDA Margin
2019A
$99,004
$99,004
$71,177
($33)
12,228
5,041
$17,236
17.4%
2020A
$121,039
$121,039
$85,810
$3,317
16,113
5,343
(12,431)
$12,342
10.2%
$208,172
105
$208,277
$159,238
$2,241
17,353
4,218
(11,153)
$12,659
6.1%
$318,259
1,556
227
$320,042
$255,441
23,114
8,291
1,660
2023E
$28,913
9.0%
$359,440
4,840
3,014
$367,294
($4,152) ($11,855)
$288,049
26,336
10,771
6,774
$32,025
8.7%
2024E
$495,093
8,970
16,513
$520,576
$392,024
$10,150
31,687
12,011
$53,848
10.3%
*Adjusted EBITDA is a non-GAAP
financial measure
I
We include Adjusted EBITDA as
a supplemental measure for
assessing operating
performance in conjunction
with related GAAP amounts
and for the following:
●
Used in conjunction with
strategic internal planning,
annual budgeting,
allocating resources and
making operating decisions
Provides useful information
for historical period-to-
period comparisons of our
business, as it removes the
effect of certain non-cash
expenses and variable
amounts
▪ A reconciliation of EBITDA to
Net Income, the most directly
comparable GAAP measure, is
shown in the accompanying
table
flyexclusive 38View entire presentation