Credit Suisse Investment Banking Pitch Book
CONFIDENTIAL
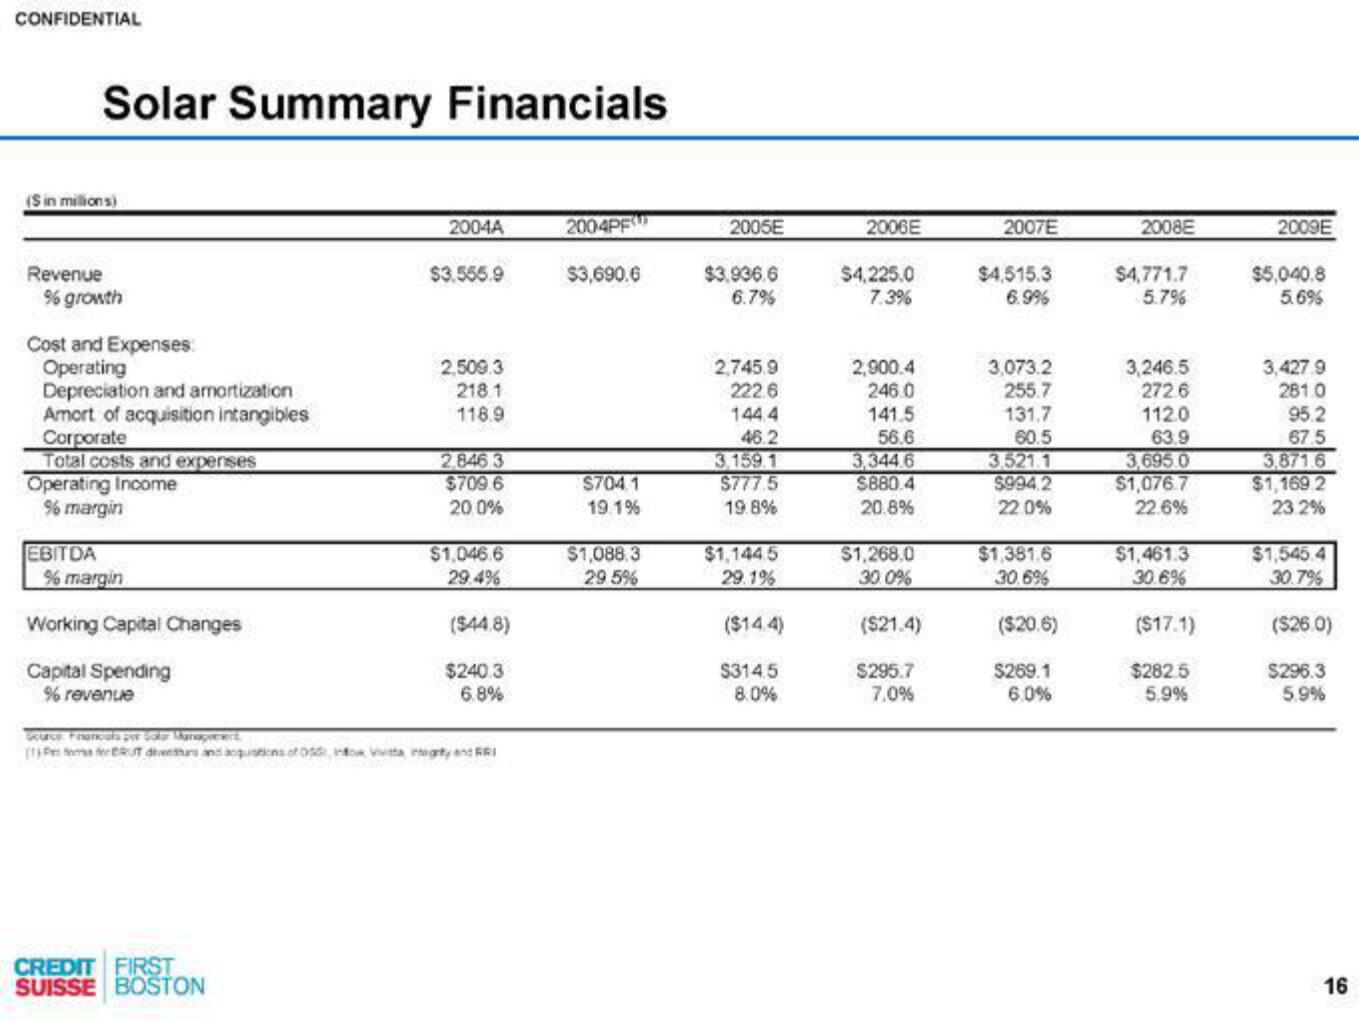
Solar Summary Financials
(Sin millions)
Revenue
% growth
Cost and Expenses:
Operating
Depreciation and amortization
Amort of acquisition intangibles
Corporate
Total costs and expenses
Operating Income
% margin
EBITDA
% margin
Working Capital Changes
Capital Spending
% revenue
2004A
CREDIT FIRST
SUISSE BOSTON
$3.555.9
2,509.3
218.1
118.9
2,846 3
$709.6
20.0%
$1,046.6
29.4%
($44.8)
$240.3
6.8%
Source Francola per Golar Manopewert
(PferERUT diturs and acquations of 055 infox Vivitta integty and RI
2004PF
$3,690.6
$704 1
19.1%
$1,088.3
29.5%
2005E
$3,936.6
6.7%
2,745.9
222.6
144.4
46.2
3.159.1
$777.5
19.8%
$1,144.5
29.1%
($14.4)
$314.5
8.0%
2006E
$4,225.0
7.3%
2,900.4
246.0
141.5
56.6
3,344.6
$880.4
20.8%
$1,268.0
30.0%
($21.4)
$295.7
7,0%
2007E
$4,515.3
6.9%
3,073.2
255.7
131.7
60.5
3.521.1
$994.2
22.0%
$1,381.6
30.6%
($20.6)
$269.1
6.0%
2008E
$4,771.7
5.7%
3,246.5
272 6
112.0
63.9
3,695.0
$1,076.7
22.6%
$1,461.3
30.6%
($17.1)
$282.5
5,9%
2009E
$5,040.8
5.6%
3,427.9
281.0
95.2
67.5
3,871.6
$1,169 2
23.2%
$1,545.4
30.7%
($26.0)
$296.3
5.9%
16View entire presentation