Solo Brands IPO Presentation Deck
Historical Financial Summary
(s)
(4)
21 (5)
(6)
(3)
($ millions)
nl
Organic
Growth (8)
Source: Company Informations
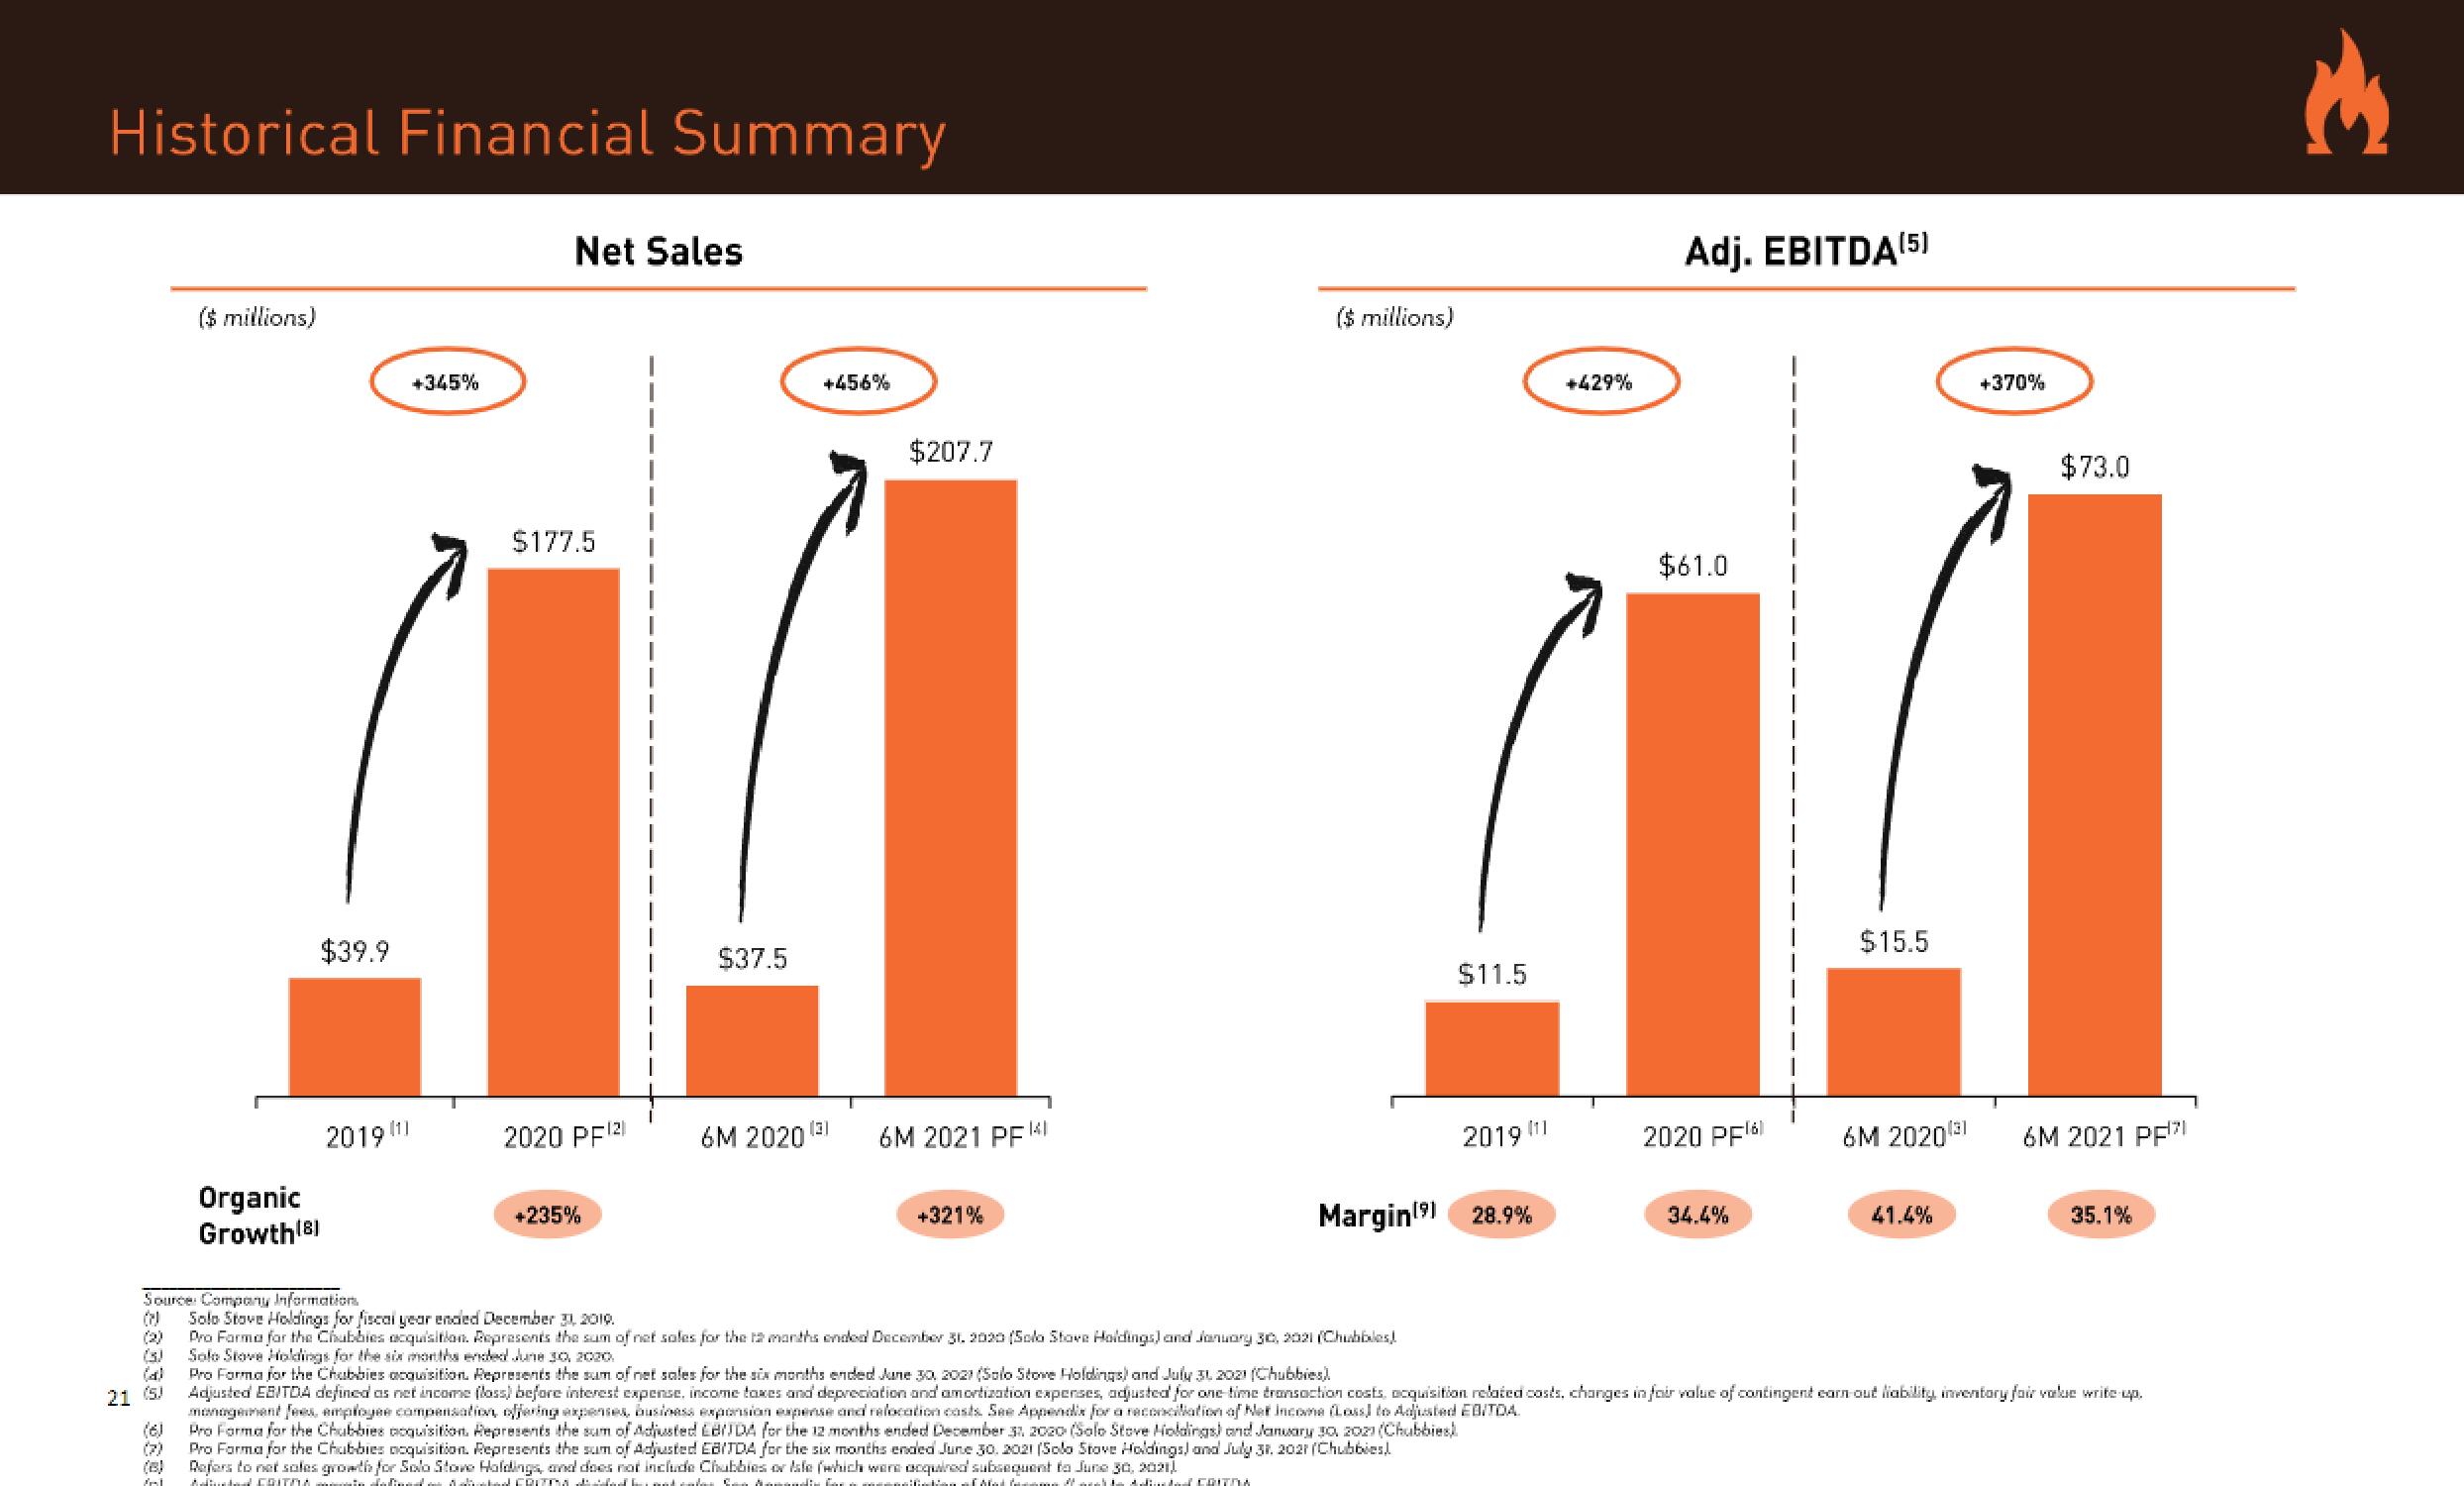
$39.9
2019 (1)
[1]
+345%
Net Sales
$177.5
2020 PF¹²
+235%
$37.5
+456%
6M 2020¹³
(3)
$207.7
6M 2021 PFKI
+321%
($ millions)
Refers to net sales growth for Solo Stove Holdings, and does not include Chubbies or Isle (which were acquired subsequent to June 30, 2021)
Alated CRITMA. Abeced CRUTTA IL not endor San Anandinformation Match da Adidad FRIDA
2019
Pro Forme for the Chubbies coquisition. Represents the sum of Adjusted EBDA for the 12 months ended December 31, 2020 (Solo Stove Holdings) and January 30, 20z (Chubbies)
Pro Forma for the Chubbies acquisition. Represents the sum of Adjusted EBITDA for the six months ended June 30, 2021 (Solo Stove Holdings) and July 31, 2021 (Chubbies!
[11
Margin¹⁹ 28.9%
+429%
$61.0
AA
$15.5
$11.5
2020 PF¹6
6M 2020¹31
Adj. EBITDA(5)
34.4%
+370%
41.4%
$73.0
6M 2021 PF¹7
Solo Stove Holdings for fiscal year ended December 31, 2019.
Pro Forma for the Chubbies acquisition. Represents the sum of net sales for the 12 months ended December 31, 2020 (Solo Stove Holdings) and January 30, 2021 (Chubbles!
Solo Stove Holdings for the six months ended June 30, 2020.
Pro Forma for the Chubbies acquisition. Represents the sum of net sales for the six months ended June 30, 2021 (Solo Stove Holdings) and July 31, 2021 (Chubbies).
Adjusted EBITDA defined as net income (loss) before interest expense, income taxes and depreciation and amortization expenses, adjusted for one time transaction costs, acquisition related costs, changes in fair value of contingent earn out liability, inventory fair value write-up.
management fees, employee compensation, offering expenses, business expansion expense and relocation costs. See Appendix for a reconciliation of Net Income (Loss) to Adjusted EBITDA.
35.1%
€View entire presentation