Pathward Financial Results Presentation Deck
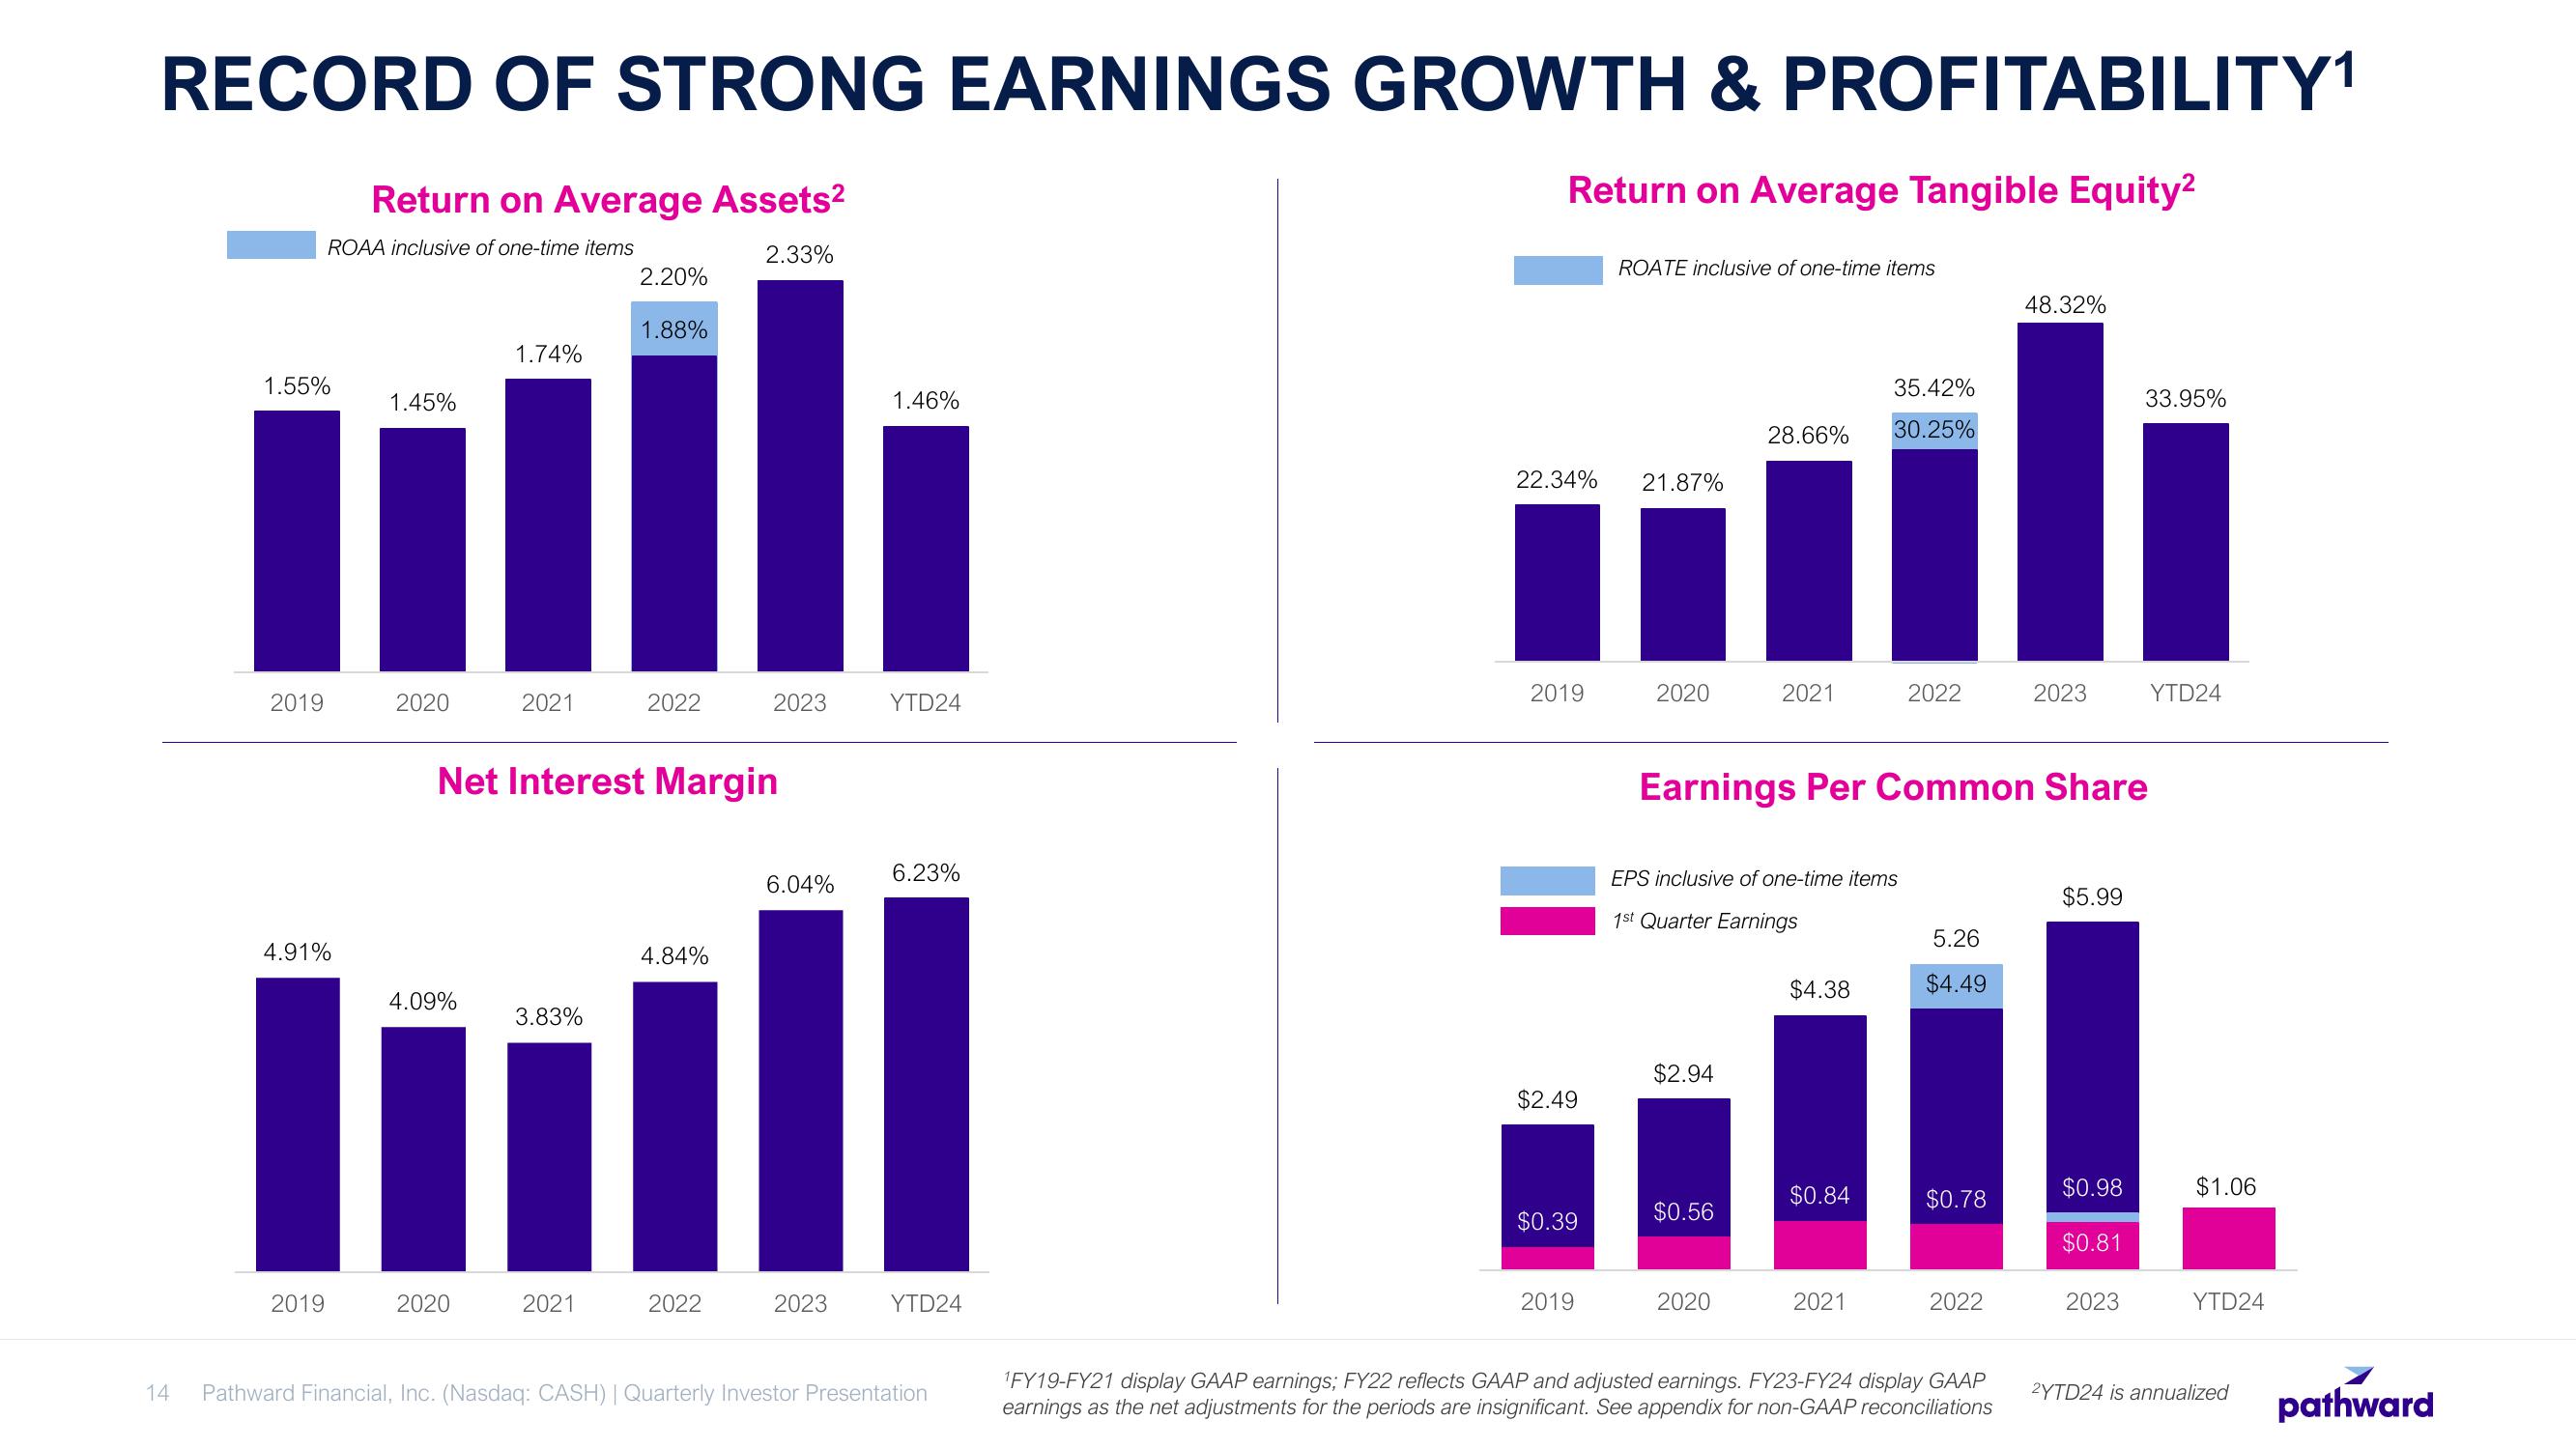
RECORD OF STRONG EARNINGS GROWTH & PROFITABILITY¹
Return on Average Tangible Equity²
14
1.55%
2019
Return on Average Assets²
ROAA inclusive of one-time items
2.33%
4.91%
2019
1.45%
2020
4.09%
1.74%
2020
2021
3.83%
2.20%
Net Interest Margin
2021
1.88%
2022
4.84%
2023
2022
6.04%
2023
1.46%
YTD24
6.23%
YTD24
Pathward Financial, Inc. (Nasdaq: CASH) | Quarterly Investor Presentation
22.34%
2019
$2.49
$0.39
2019
ROATE inclusive of one-time items
21.87%
2020
$2.94
35.42%
28.66% 30.25%
EPS inclusive of one-time items
1st Quarter Earnings
$0.56
2021
2020
Earnings Per Common Share
$4.38
$0.84
2022
2021
5.26
$4.49
$0.78
2022
48.32%
¹FY19-FY21 display GAAP earnings; FY22 reflects GAAP and adjusted earnings. FY23-FY24 display GAAP
earnings as the net adjustments for the periods are insignificant. See appendix for non-GAAP reconciliations
2023
$5.99
$0.98
$0.81
33.95%
2023
YTD24
$1.06
YTD24
2YTD24 is annualized
pathwardView entire presentation