AES Panama Investor Presentation
Financial Metrics
EBITDA
Cashflow from Operations
CAPEX
40.8%
37.8%
37.8%
29.5%
$137.3
$129.7
$119.1
$99.8
5.4%
3.0%
2.9%
7.0%
$100.3
$100.4
$87.6
$77.5
$18.6
$20.3
AES Panamá
$10.9
$9.7
2017
2018
2019
2020
2017
2018
2019
2020
2017
2018
2019
2020
Revenue Margin
Capex/Revenues
AES
Changuinola
75.4%
73.4%
77.3%
152.4%
$85.5
$74.8
$82.5
0.7%
7.8%
7.0%
$74.5
$69.5
$41.9
9.8%
$28.2
$8.8
$6.3
$2.7
$0.7
$2.5
2017
2018
2019
2020
2017
2018
2019
2020
2017
2018
2019
2020
-Capex/Revenues
Revenue Margin
39.2%
126.9%
$78.7
$25.0
$110.0
16.9%
4.1%
$49.4
-$52.4
2020
2018
2019
2020
2018
$9.8
2019
2020
-Capex/Revenues
aes
24.5%
28.3%
$94.3
$82.7
AES Colon
$21.3
2018
2019
Revenue Margin
15
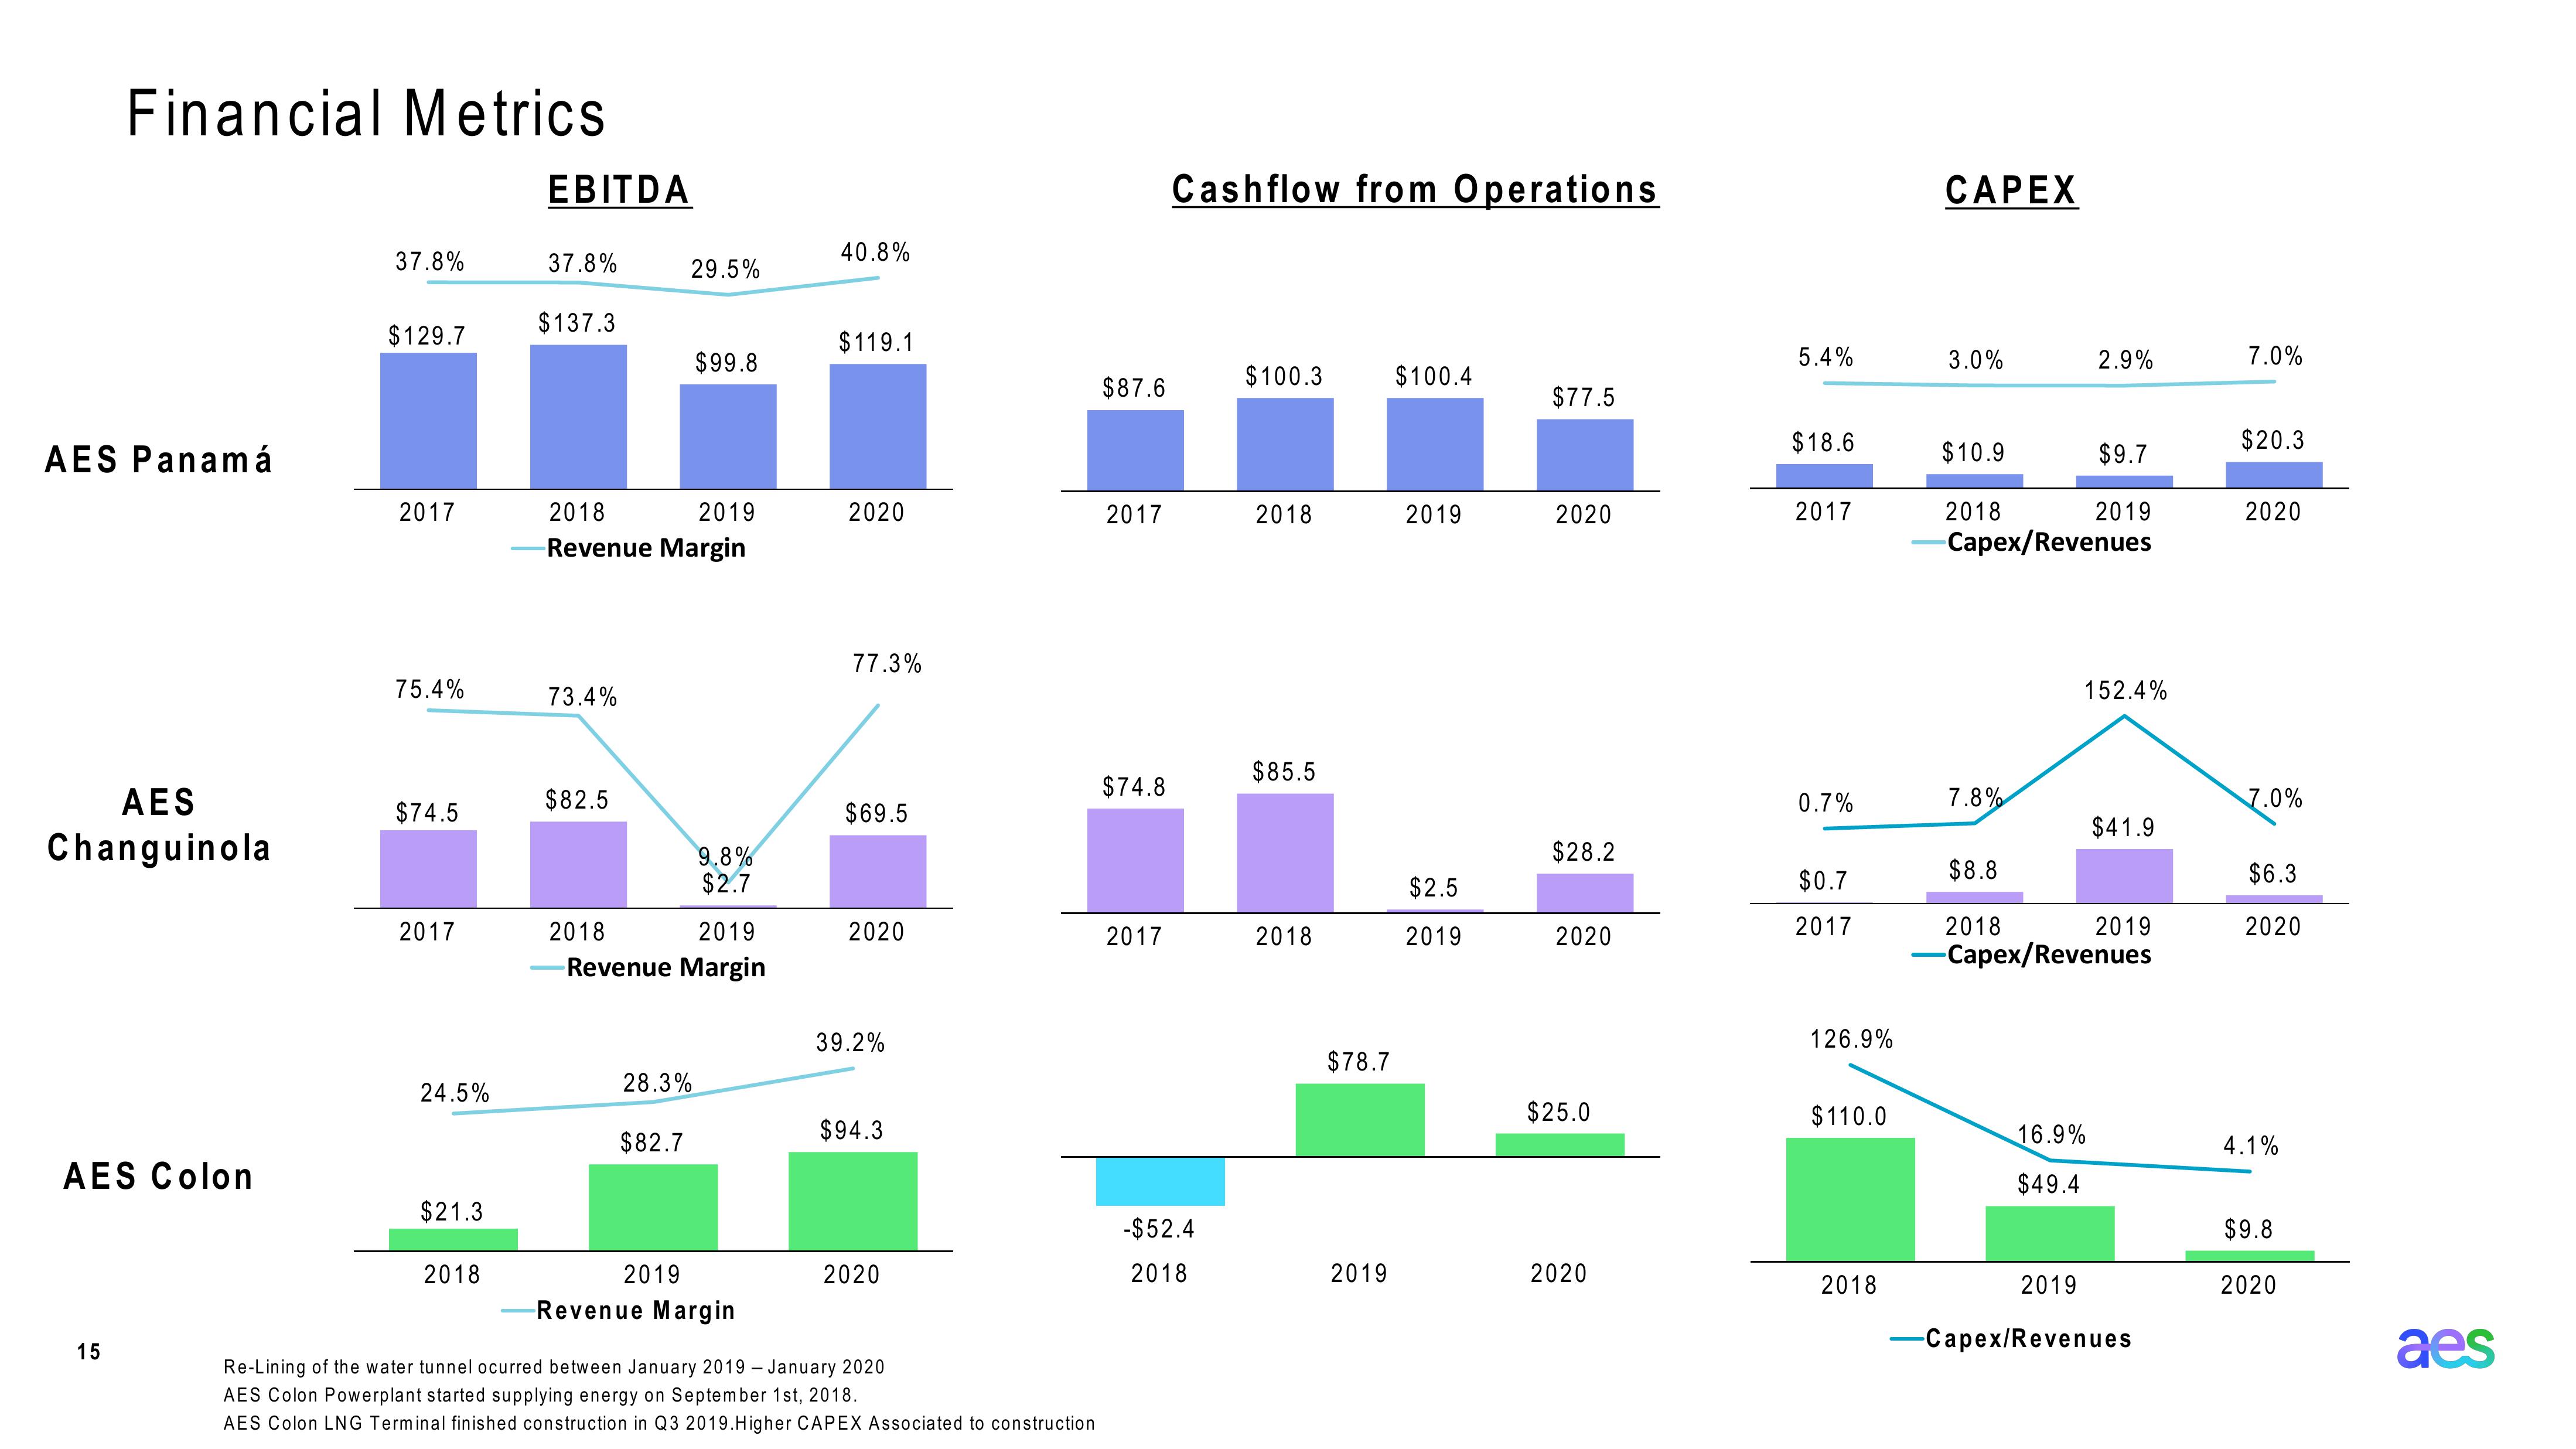
Re-Lining of the water tunnel ocurred between January 2019 - January 2020
AES Colon Powerplant started supplying energy on September 1st, 2018.
AES Colon LNG Terminal finished construction in Q3 2019. Higher CAPEX Associated to constructionView entire presentation