Intertek Results Presentation Deck
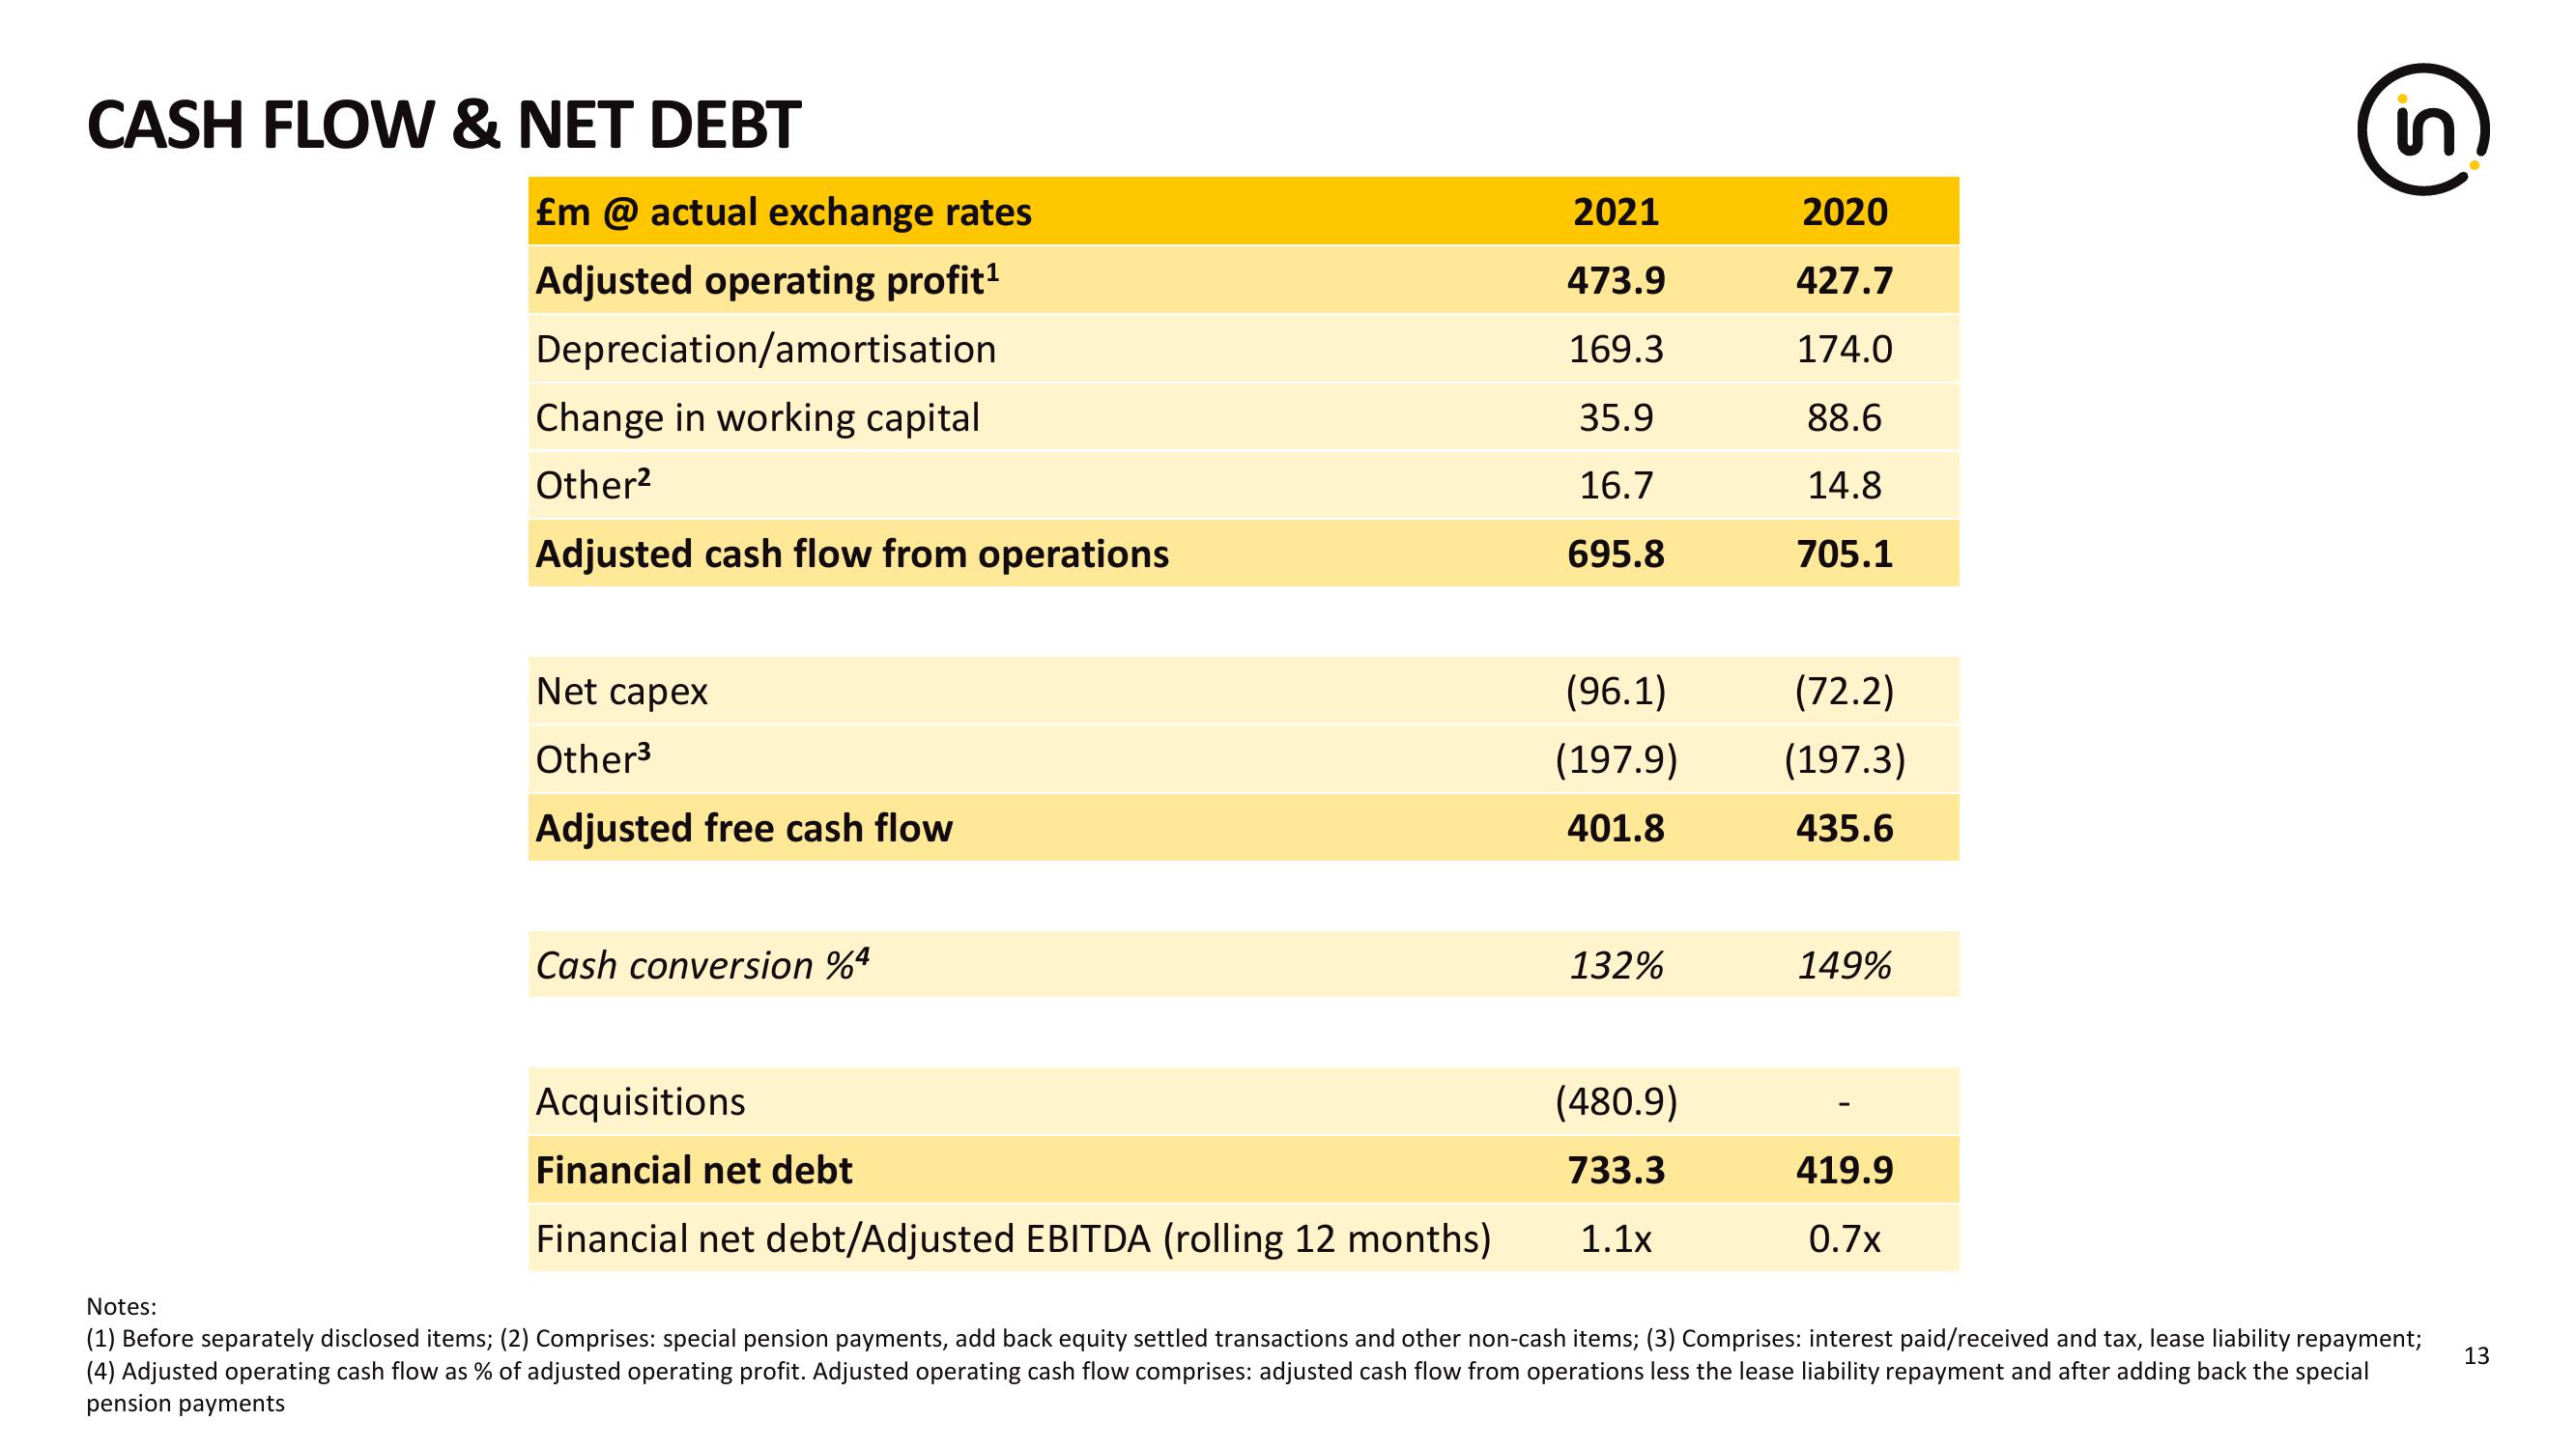
CASH FLOW & NET DEBT
£m @ actual exchange rates
Adjusted operating profit¹
Depreciation/amortisation
Change in working capital
Other²
Adjusted cash flow from operations
Net capex
Other³
Adjusted free cash flow
Cash conversion %4
Acquisitions
Financial net debt
Financial net debt/Adjusted EBITDA (rolling 12 months)
2021
473.9
169.3
35.9
16.7
695.8
(96.1)
(197.9)
401.8
132%
(480.9)
733.3
1.1x
2020
427.7
174.0
88.6
14.8
705.1
(72.2)
(197.3)
435.6
149%
419.9
0.7x
in
Notes:
(1) Before separately disclosed items; (2) Comprises: special pension payments, add back equity settled transactions and other non-cash items; (3) Comprises: interest paid/received and tax, lease liability repayment;
(4) Adjusted operating cash flow as % of adjusted operating profit. Adjusted operating cash flow comprises: adjusted cash flow from operations less the lease liability repayment and after adding back the special
pension payments
13View entire presentation