Telia Company Results Presentation Deck
FINLAND-Q4 2020
LO
5
SERVICE REVENUES & ADJUSTED EBITDA
Like for like growth Excl. Covid-19 impact
●
●
●
0%
-1.9%
Q4 Q1 Q2 Q3 Q4
19 20 20 20 20
Service revenues
-4%
-4.9%
Q4 Q1 Q2 Q3 Q4
19 20 20 20 20
EBITDA
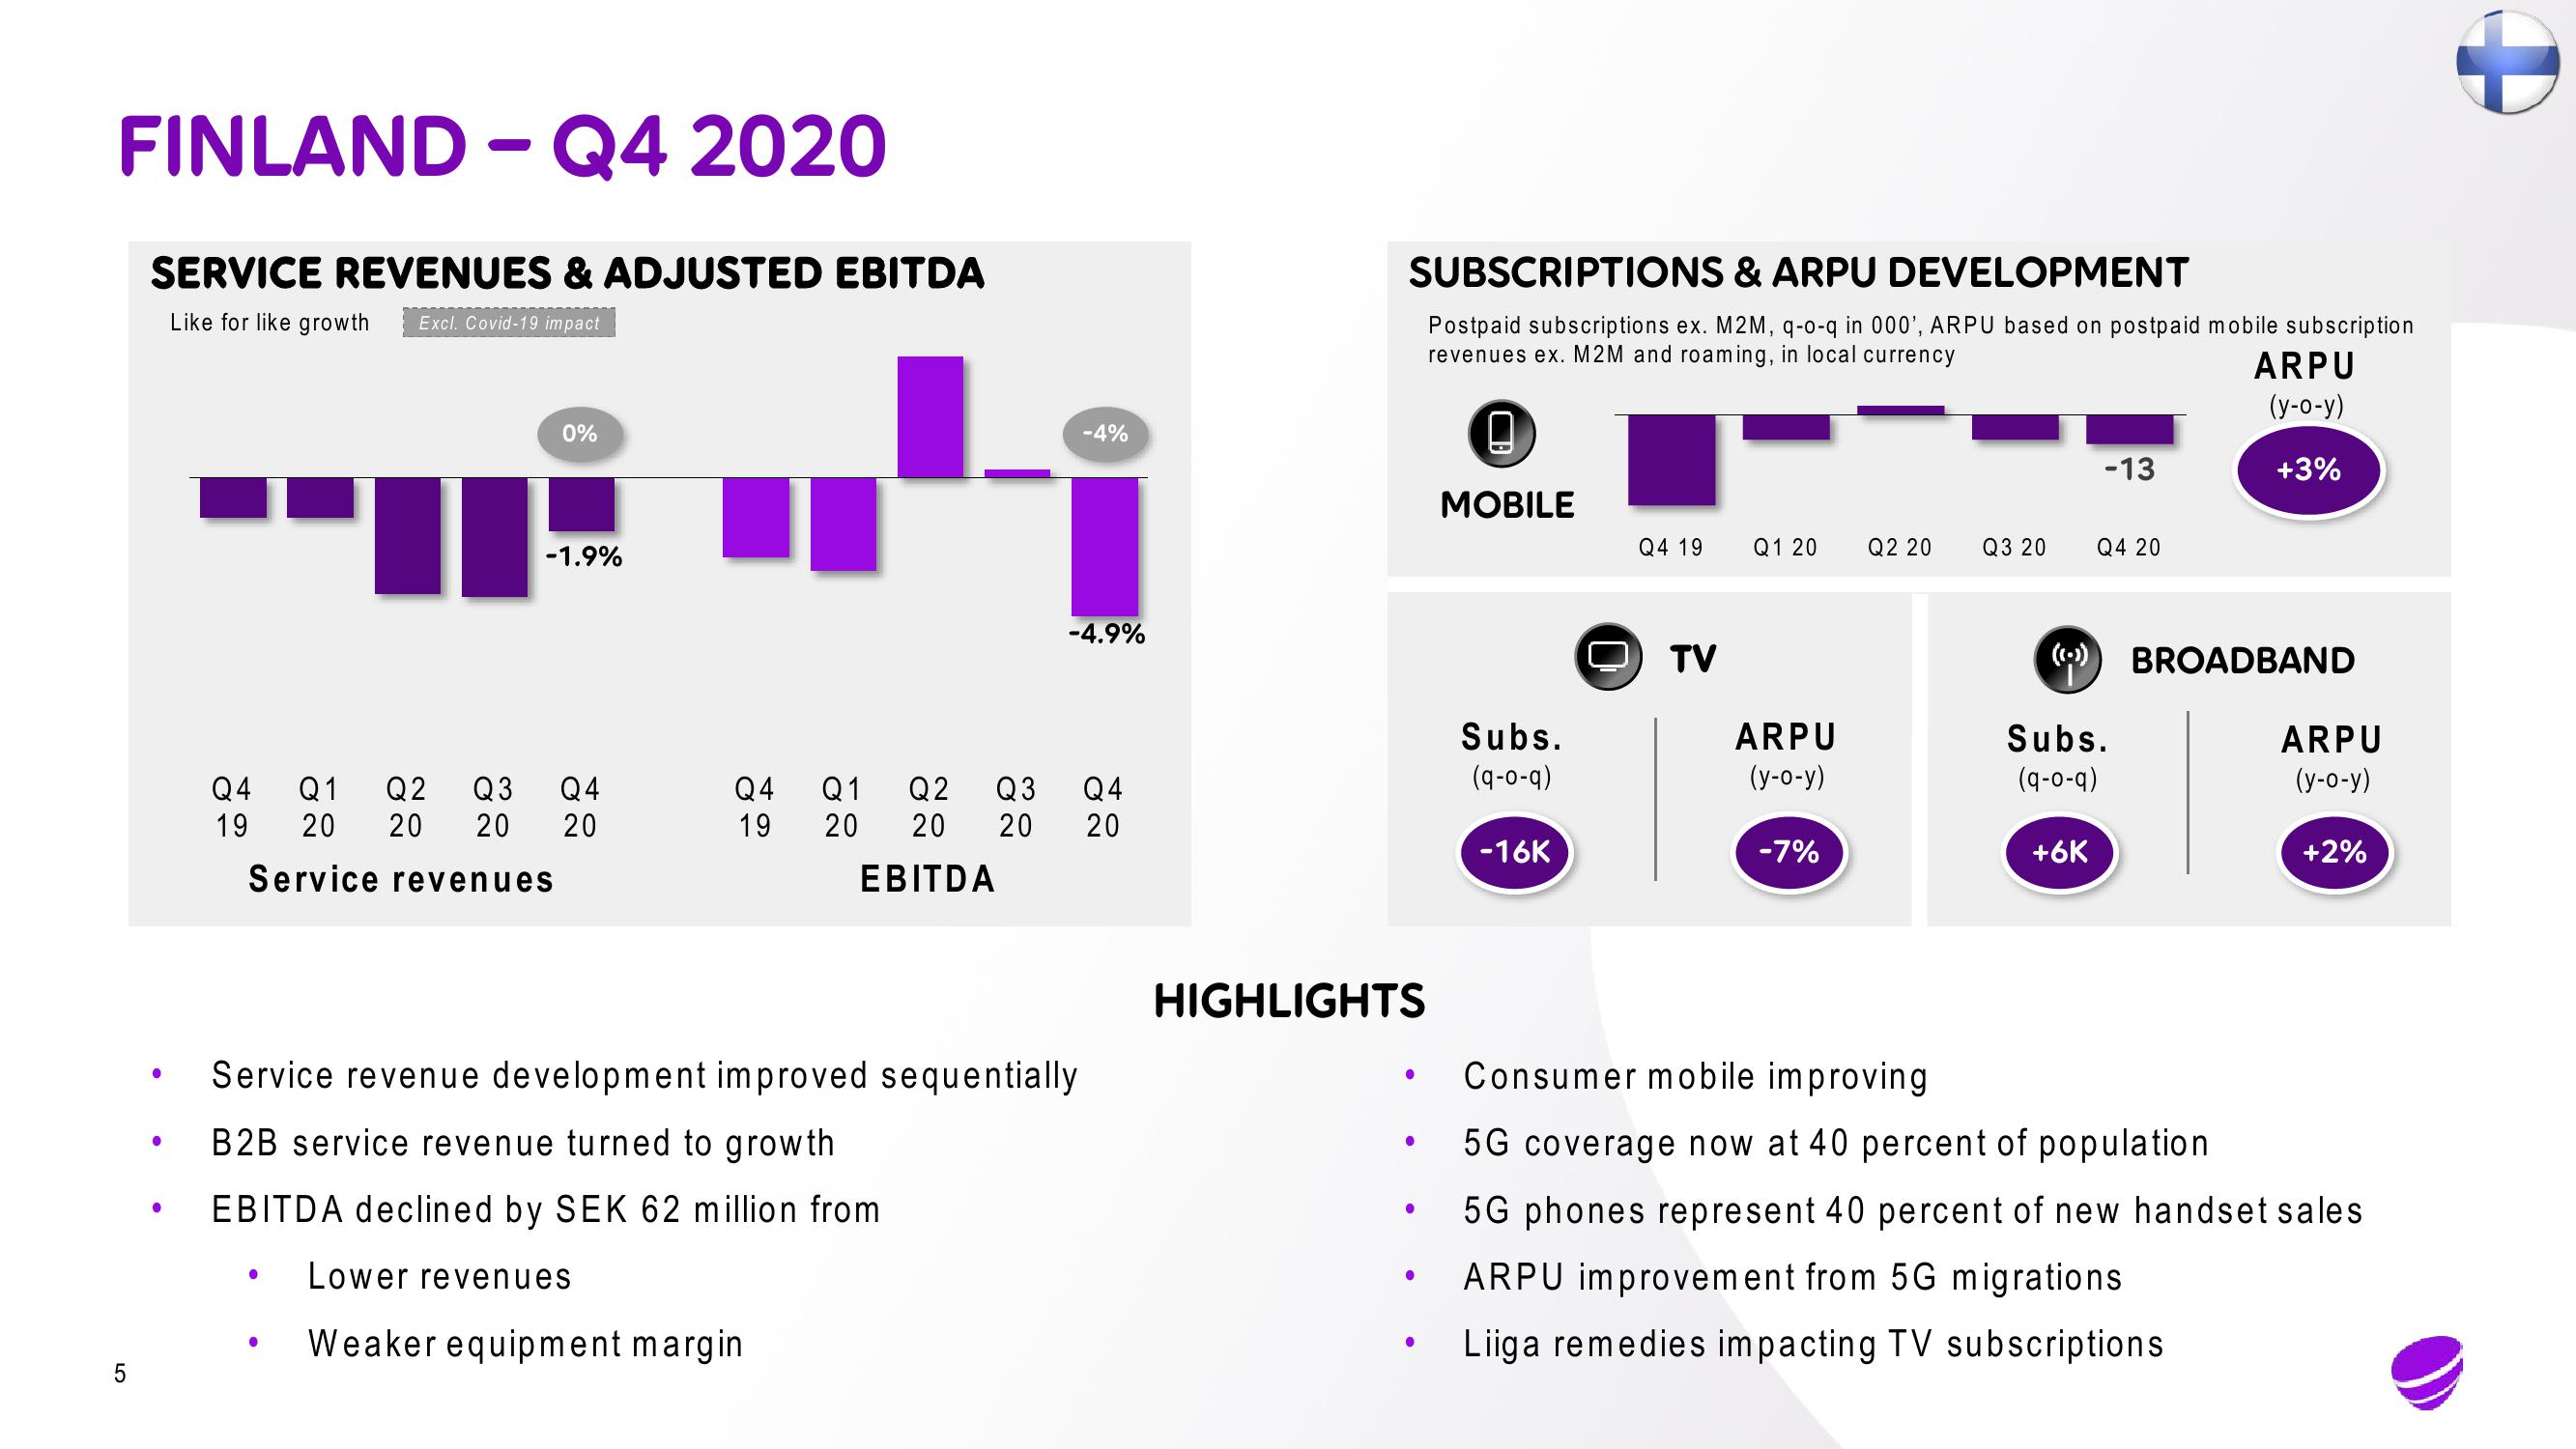
Service revenue development improved sequentially
B2B service revenue turned to growth
EBITDA declined by SEK 62 million from
Lower revenues
Weaker equipment margin
SUBSCRIPTIONS & ARPU DEVELOPMENT
Postpaid subscriptions ex. M2M, q-o-q in 000', ARPU based on postpaid mobile subscription
revenues ex. M2M and roaming, in local currency
HIGHLIGHTS
●
●
●
●
●
MOBILE
Subs.
(9-0-9)
-16K
U
Q4 19
TV
Q1 20
ARPU
(y-o-y)
-7%
Q2 20
Q3 20
((:))
-13
+6K
Q4 20
Subs.
(9-0-9)
ARPU
(y-o-y)
+3%
BROADBAND
ARPU
(y-o-y)
+2%
Consumer mobile improving
5G coverage now at 40 percent of population.
5G phones represent 40 percent of new handset sales
ARPU improvement from 5G migrations
Liiga remedies impacting TV subscriptionsView entire presentation