GMS Investor Conference Presentation Deck
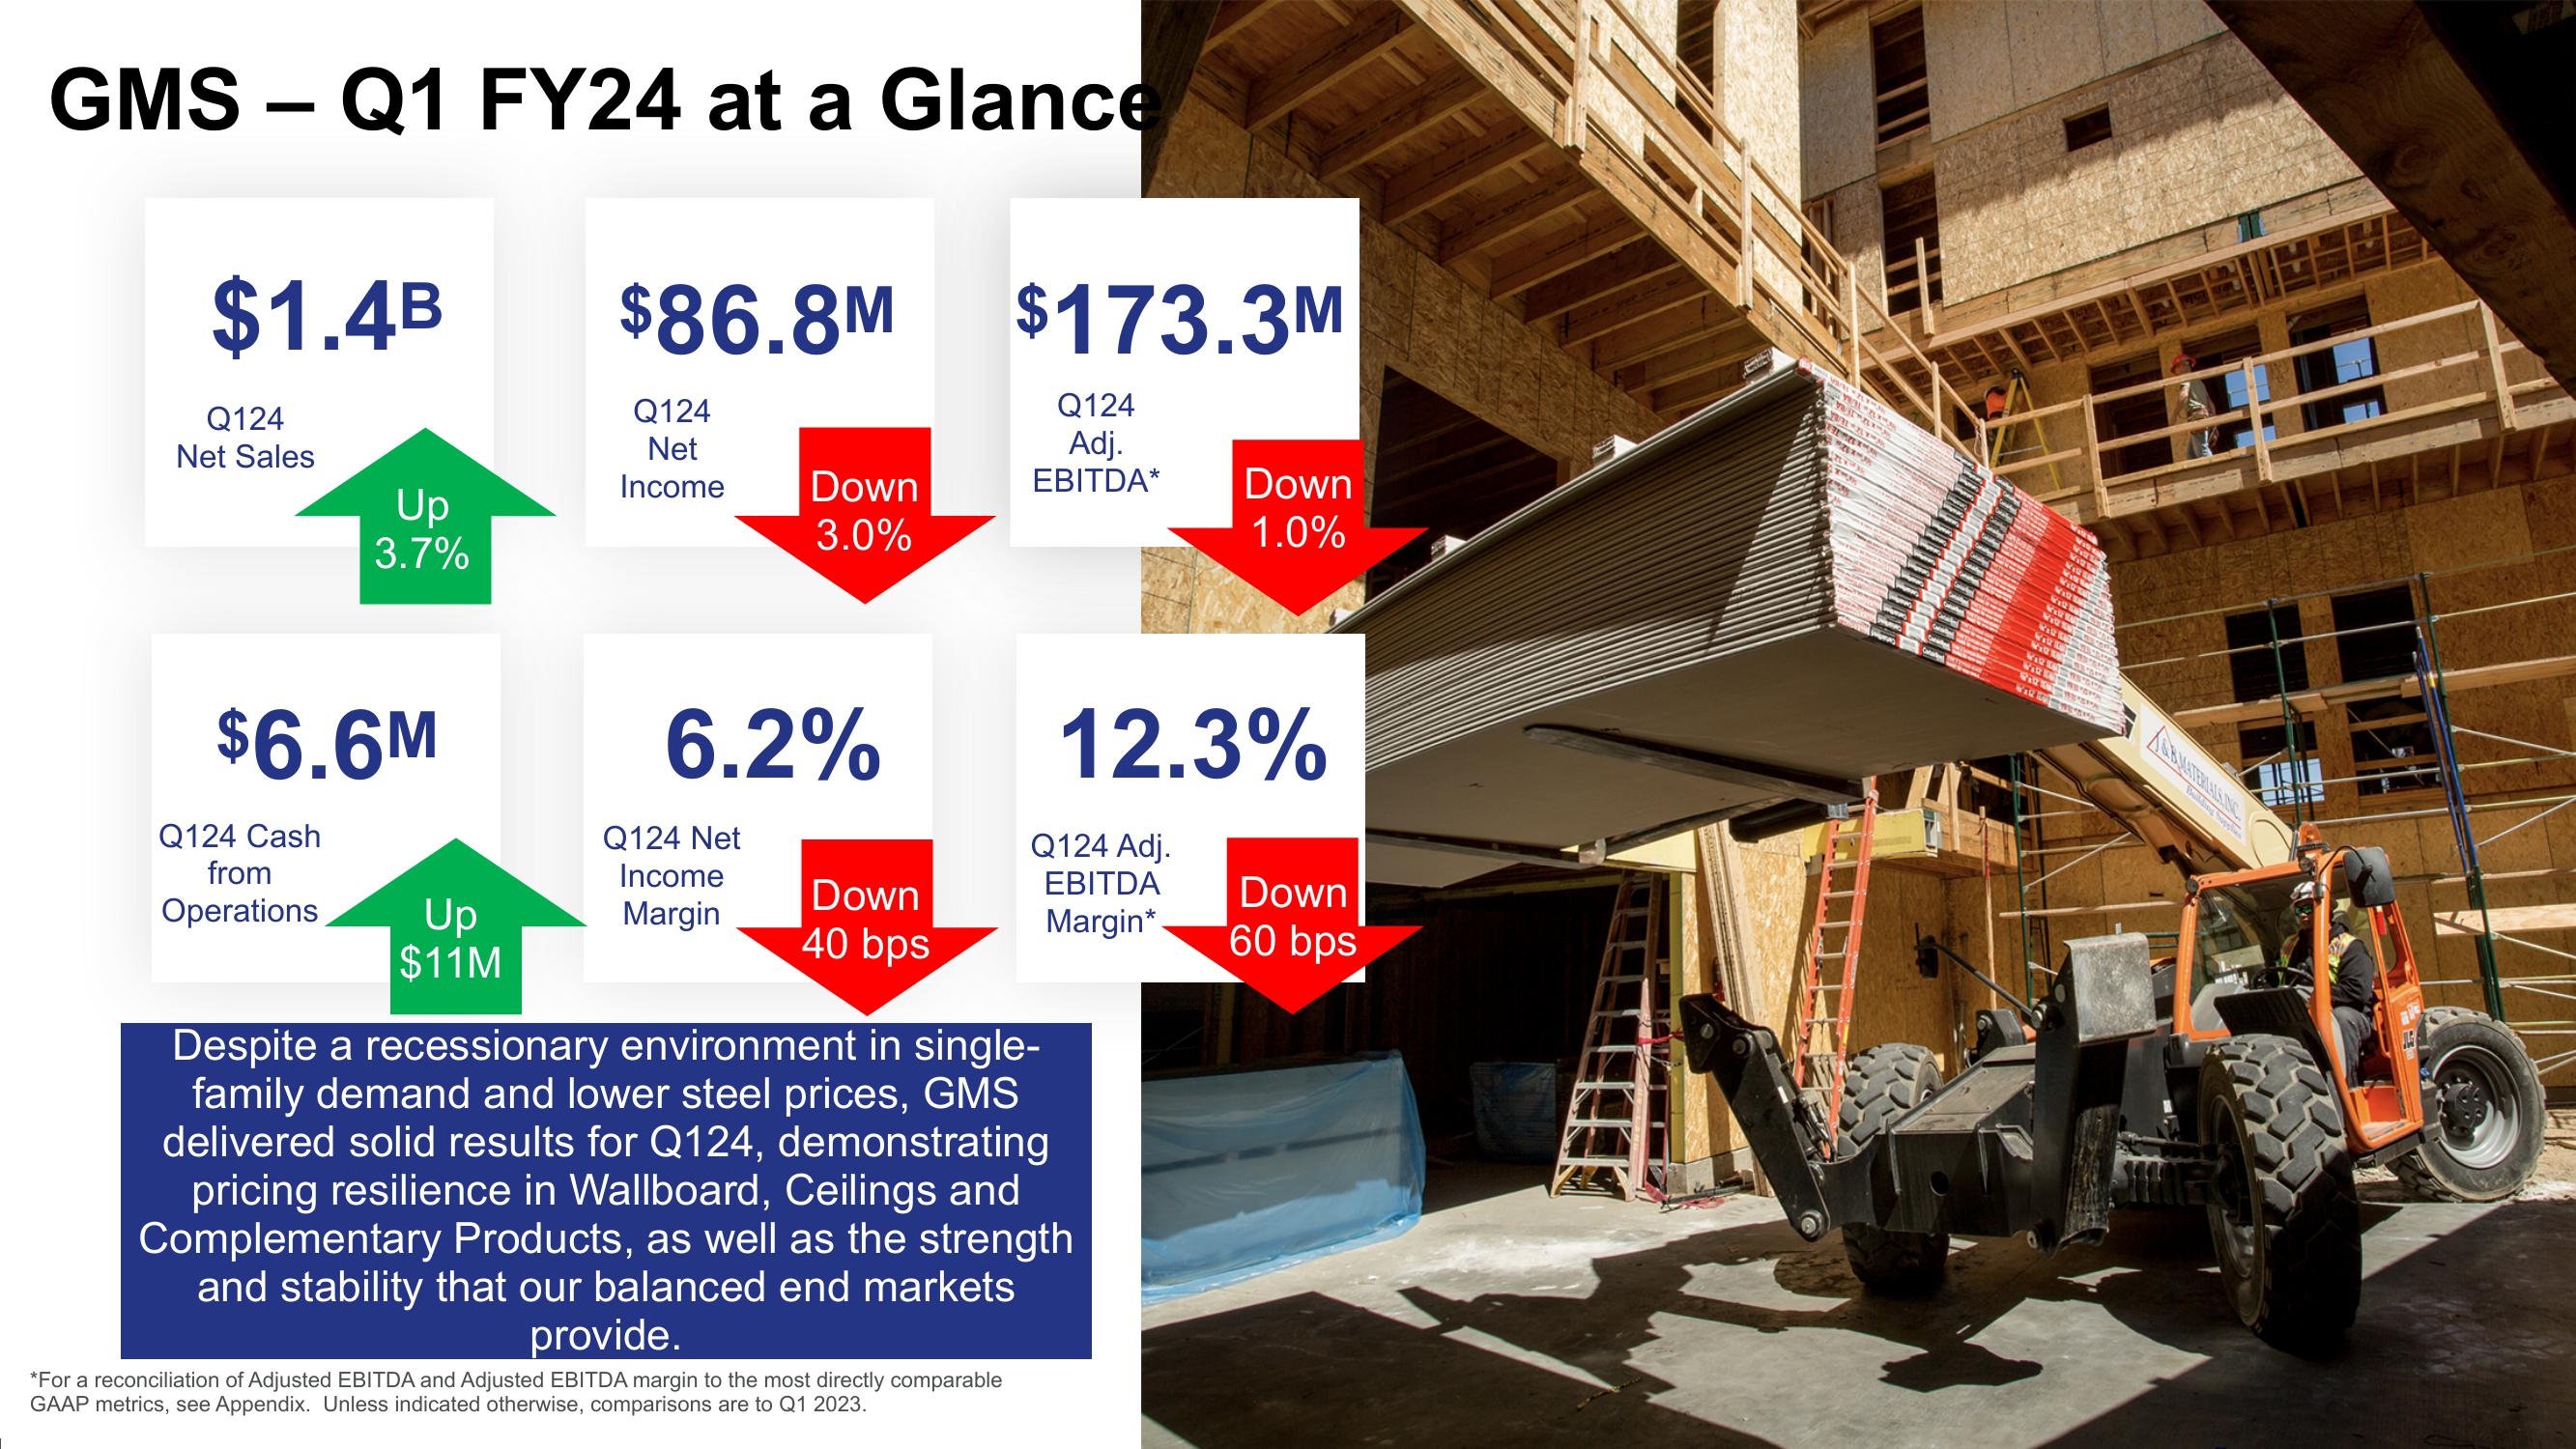
GMS - Q1 FY24 at a Glance
$1.4B
Q124
Net Sales
Up
3.7%
$6.6M
Q124 Cash
from
Operations
Up
$11M
$86.8M
Q124
Net
Income Down
3.0%
6.2%
Q124 Net
Income
Margin
Down
40 bps
$173.3M
*For a reconciliation of Adjusted EBITDA and Adjusted EBITDA margin to the most directly comparable
GAAP metrics, see Appendix. Unless indicated otherwise, comparisons are to Q1 2023.
Q124
Adj.
EBITDA*
12.3%
Q124 Adj.
EBITDA
Margin*
Despite a recessionary environment in single-
family demand and lower steel prices, GMS
delivered solid results for Q124, demonstrating
pricing resilience in Wallboard, Ceilings and
Complementary Products, as well as the strength
and stability that our balanced end markets
provide.
Down
1.0%
Down
60 bps
-PLY
STRON
BUN
MA
Mex
X-
WIRE
2125
WHO
CD
F
Building SuppliesView entire presentation