Pershing Square Investor Presentation Deck
Strong Performance During the COVID Crisis
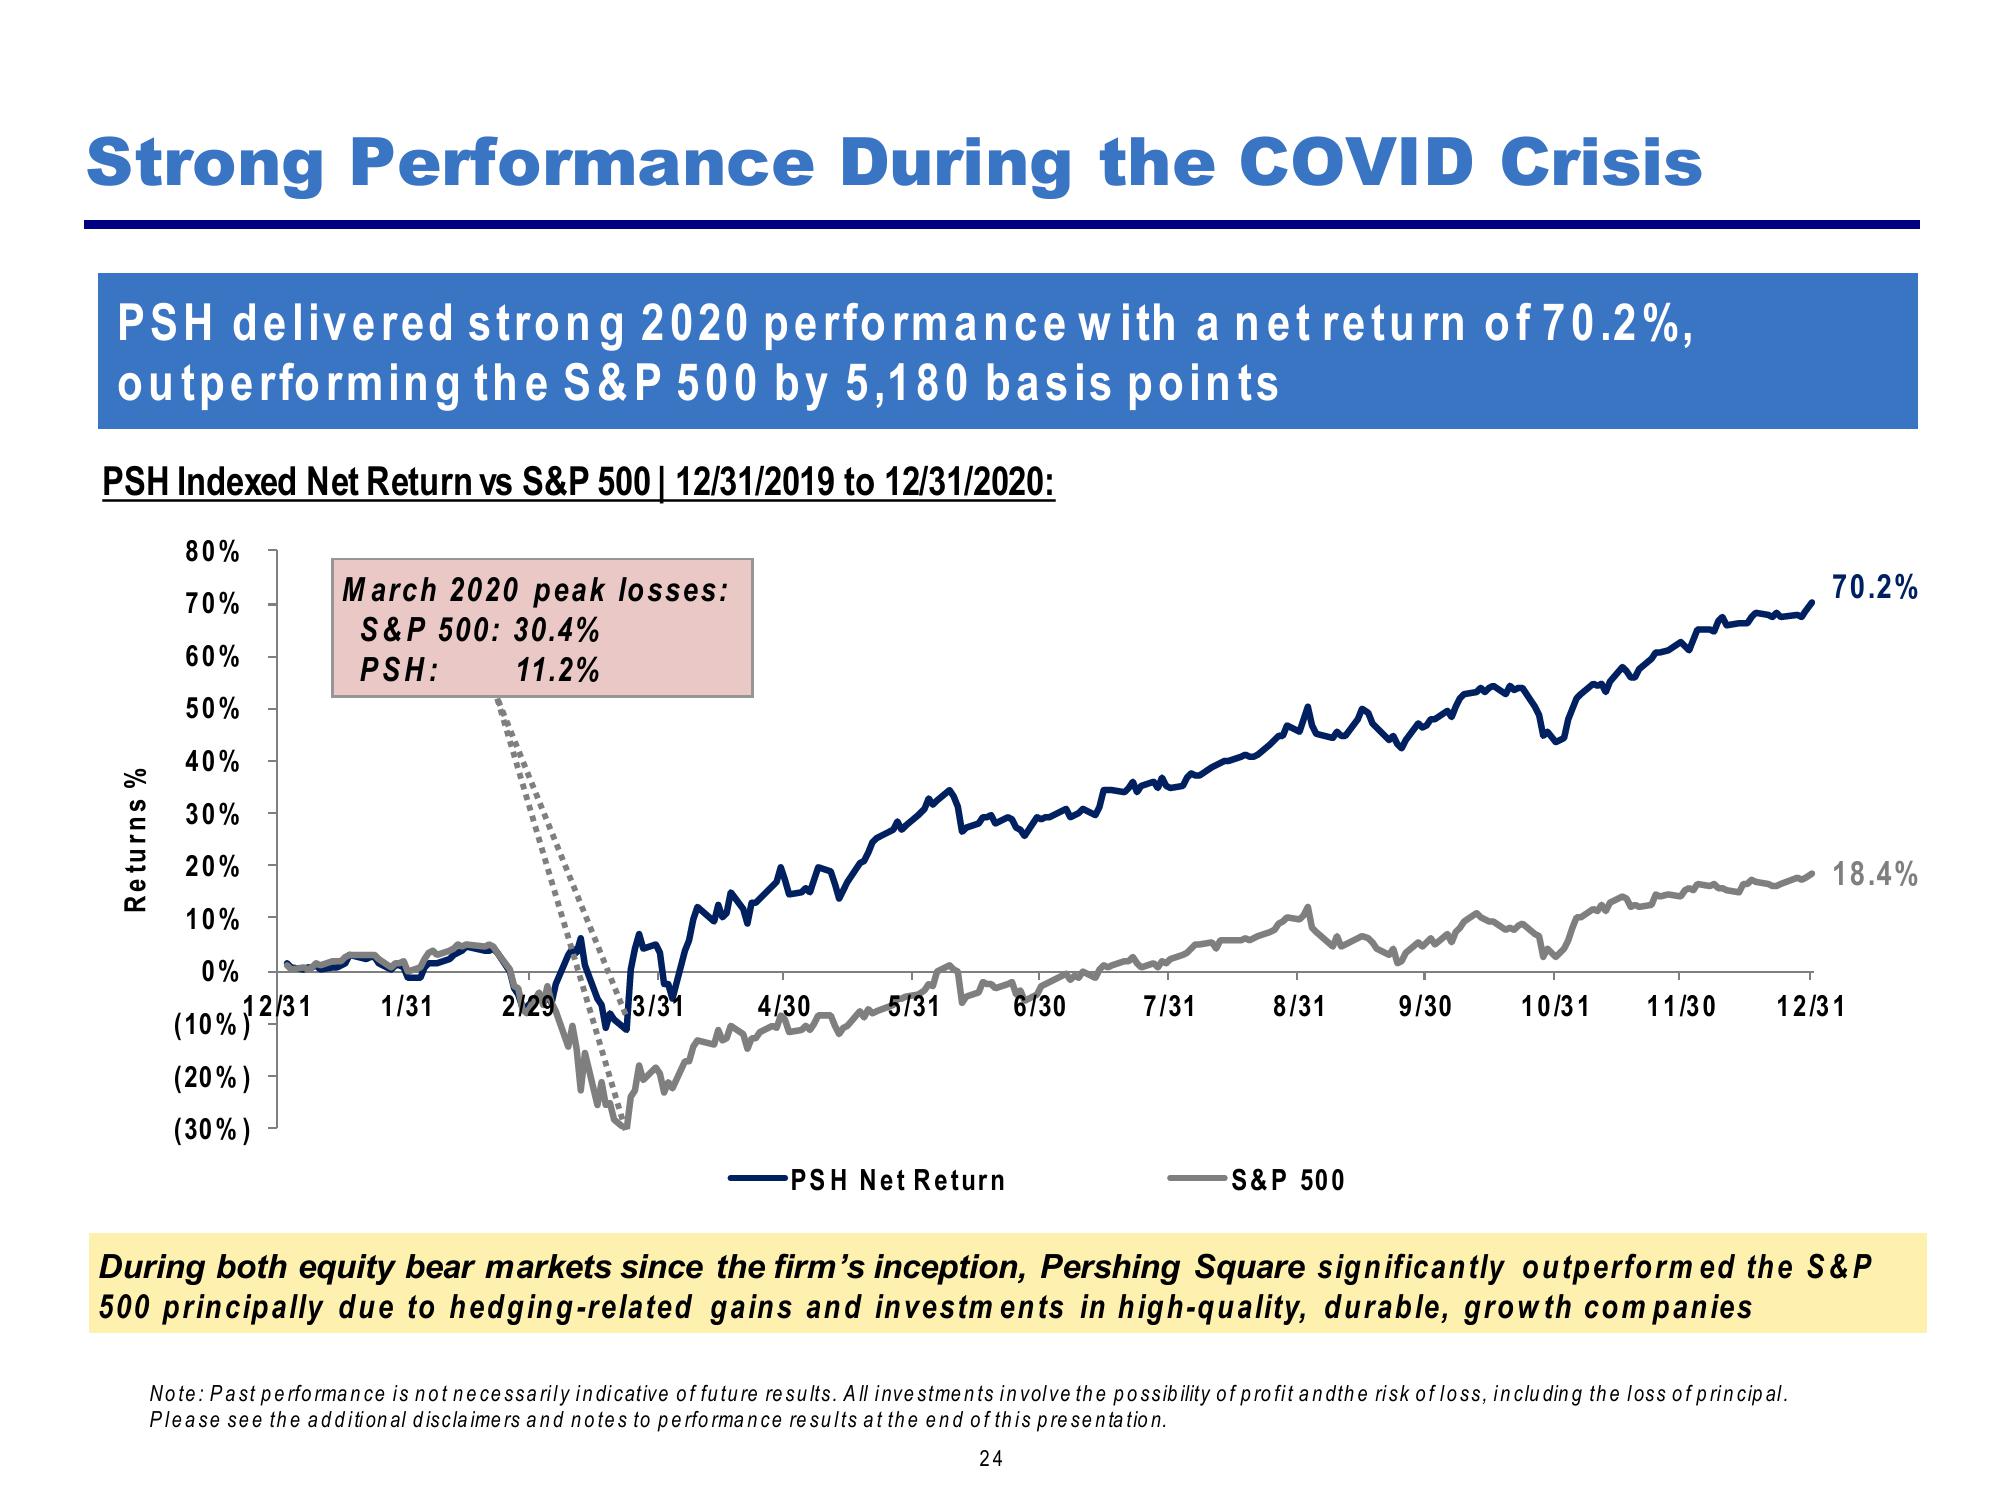
PSH delivered strong 2020 performance with a net return of 70.2%,
outperforming the S&P 500 by 5,180 basis points
PSH Indexed Net Return vs S&P 500 | 12/31/2019 to 12/31/2020:
Returns %
80%
70%
60%
50%
40%
30%
20%
10%
0%
(10%)¹2
(20%)
(30%)
131
March 2020 peak losses:
S&P 500: 30.4%
PSH:
11.2%
1/31
2/29
3/31
4/30
5/31
PSH Net Return
6/30
7/31
8/31
S&P 500
9/30
70.2%
18.4%
10/31 11/30 12/31
Note: Past performance is not necessarily indicative of future results. All investments involve the possibility of profit and the risk of loss, including the loss of principal.
Please see the additional disclaimers and notes to performance results at the end of this presentation.
24
During both equity bear markets since the firm's inception, Pershing Square significantly outperformed the S&P
500 principally due to hedging-related gains and investments in high-quality, durable, growth companiesView entire presentation