First Busey Results Presentation Deck
4Q23 Earnings Investor Presentation
Diversified and Significant Sources of Fee Income
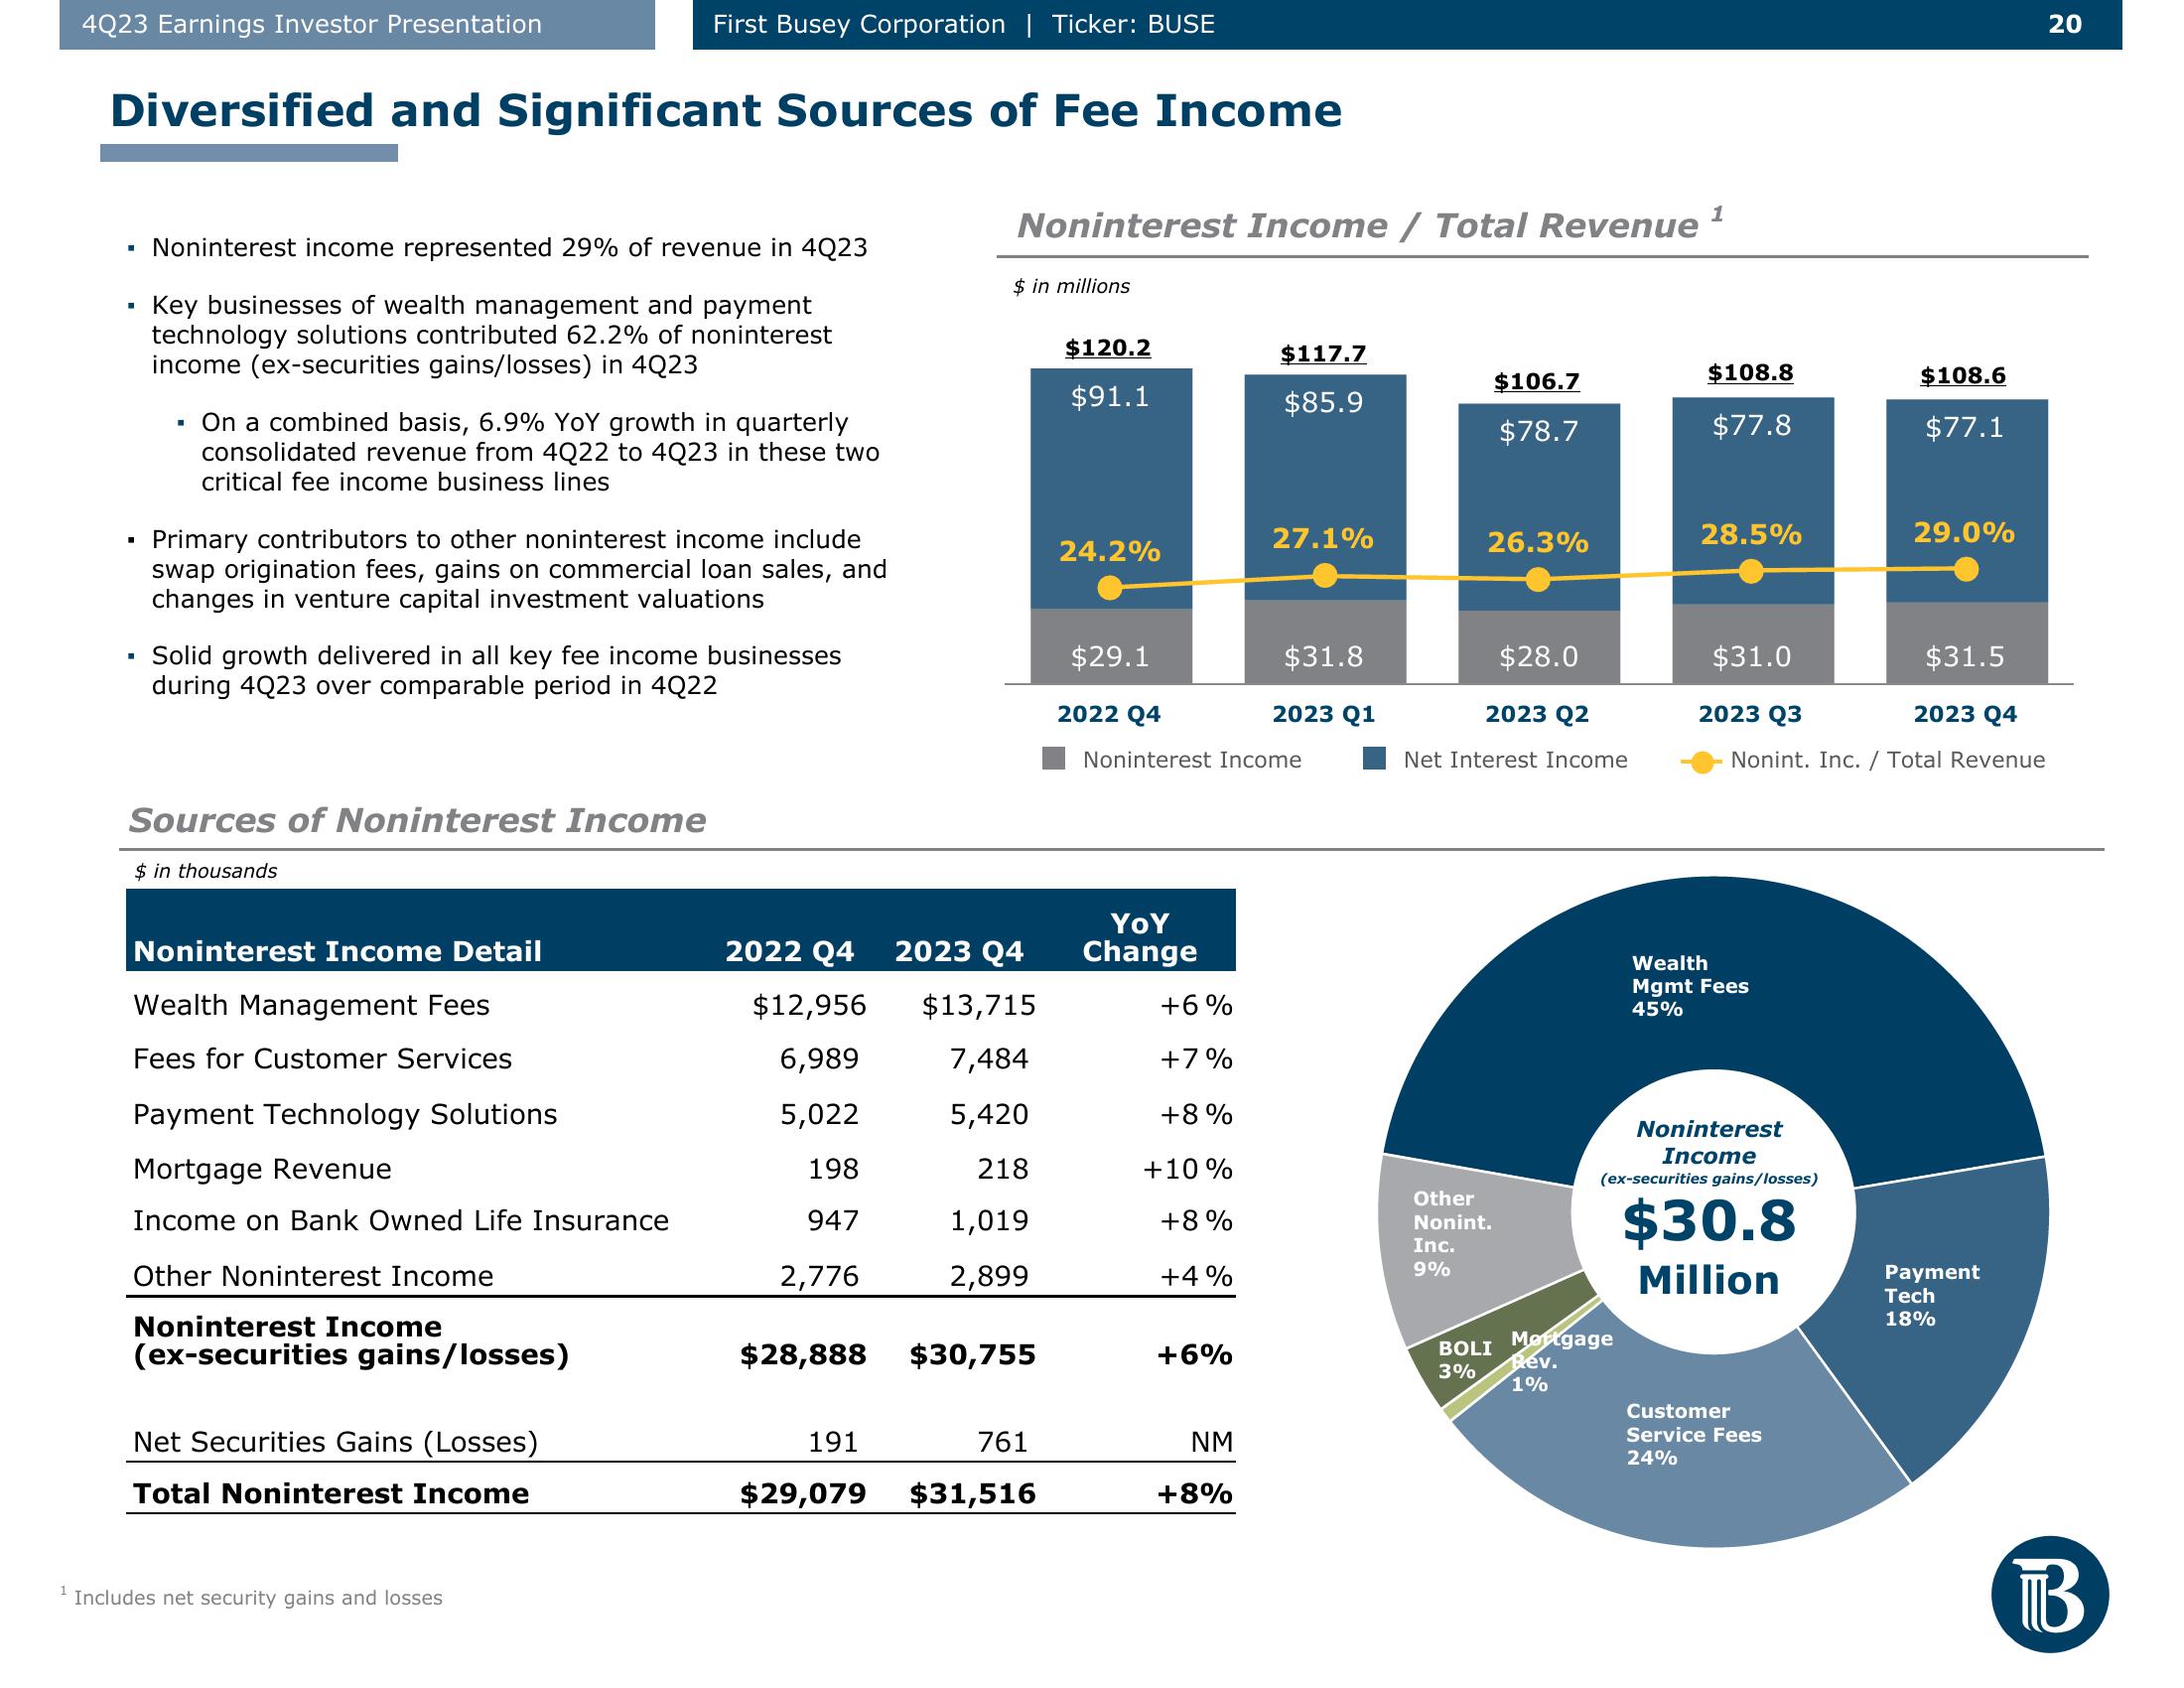
▪ Noninterest income represented 29% of revenue in 4Q23
Key businesses of wealth management and payment
technology solutions contributed 62.2% of noninterest
income (ex-securities gains/losses) in 4Q23
■
■
■
On a combined basis, 6.9% YoY growth in quarterly
consolidated revenue from 4Q22 to 4Q23 in these two
critical fee income business lines
Primary contributors to other noninterest income include
swap origination fees, gains on commercial loan sales, and
changes in venture capital investment valuations
Solid growth delivered in all key fee income businesses
during 4Q23 over comparable period in 4Q22
Sources of Noninterest Income
$ in thousands
Noninterest Income Detail
First Busey Corporation | Ticker: BUSE
Wealth Management Fees
Fees for Customer Services
Payment Technology Solutions
Mortgage Revenue
Income on Bank Owned Life Insurance
Other Noninterest Income
Noninterest Income
(ex-securities gains/losses)
Net Securities Gains (Losses)
Total Noninterest Income
Includes net security gains and losses
2022 Q4
$12,956
6,989
5,022
198
947
2,776
Noninterest Income / Total Revenue
$ in millions
2023 Q4
$13,715
7,484
5,420
218
1,019
2,899
$28,888 $30,755
191
761
$29,079 $31,516
$120.2
$91.1
24.2%
$29.1
2022 Q4
YOY
Change
+6%
+7%
+8%
+10%
+8%
+4%
+6%
$117.7
$85.9
Noninterest Income
NM
+8%
27.1%
$31.8
2023 Q1
26.3%
Other
Nonint.
Inc.
9%
$106.7
$78.7
2023 Q2
Net Interest Income
BOLI
3%
$28.0
1
Mortgage
Rev.
1%
$108.8
$77.8
28.5%
$31.0
$31.5
2023 Q4
Nonint. Inc. / Total Revenue
2023 Q3
Wealth
Mgmt Fees
45%
Noninterest
Income
(ex-securities gains/losses)
$30.8
Million
$108.6
$77.1
Customer
Service Fees
24%
29.0%
Payment
Tech
18%
20
BView entire presentation