Snap Inc Investor Presentation Deck
Snap Inc.
Annual infrastructure
costs per DAU
$1,180
2018
$2.92
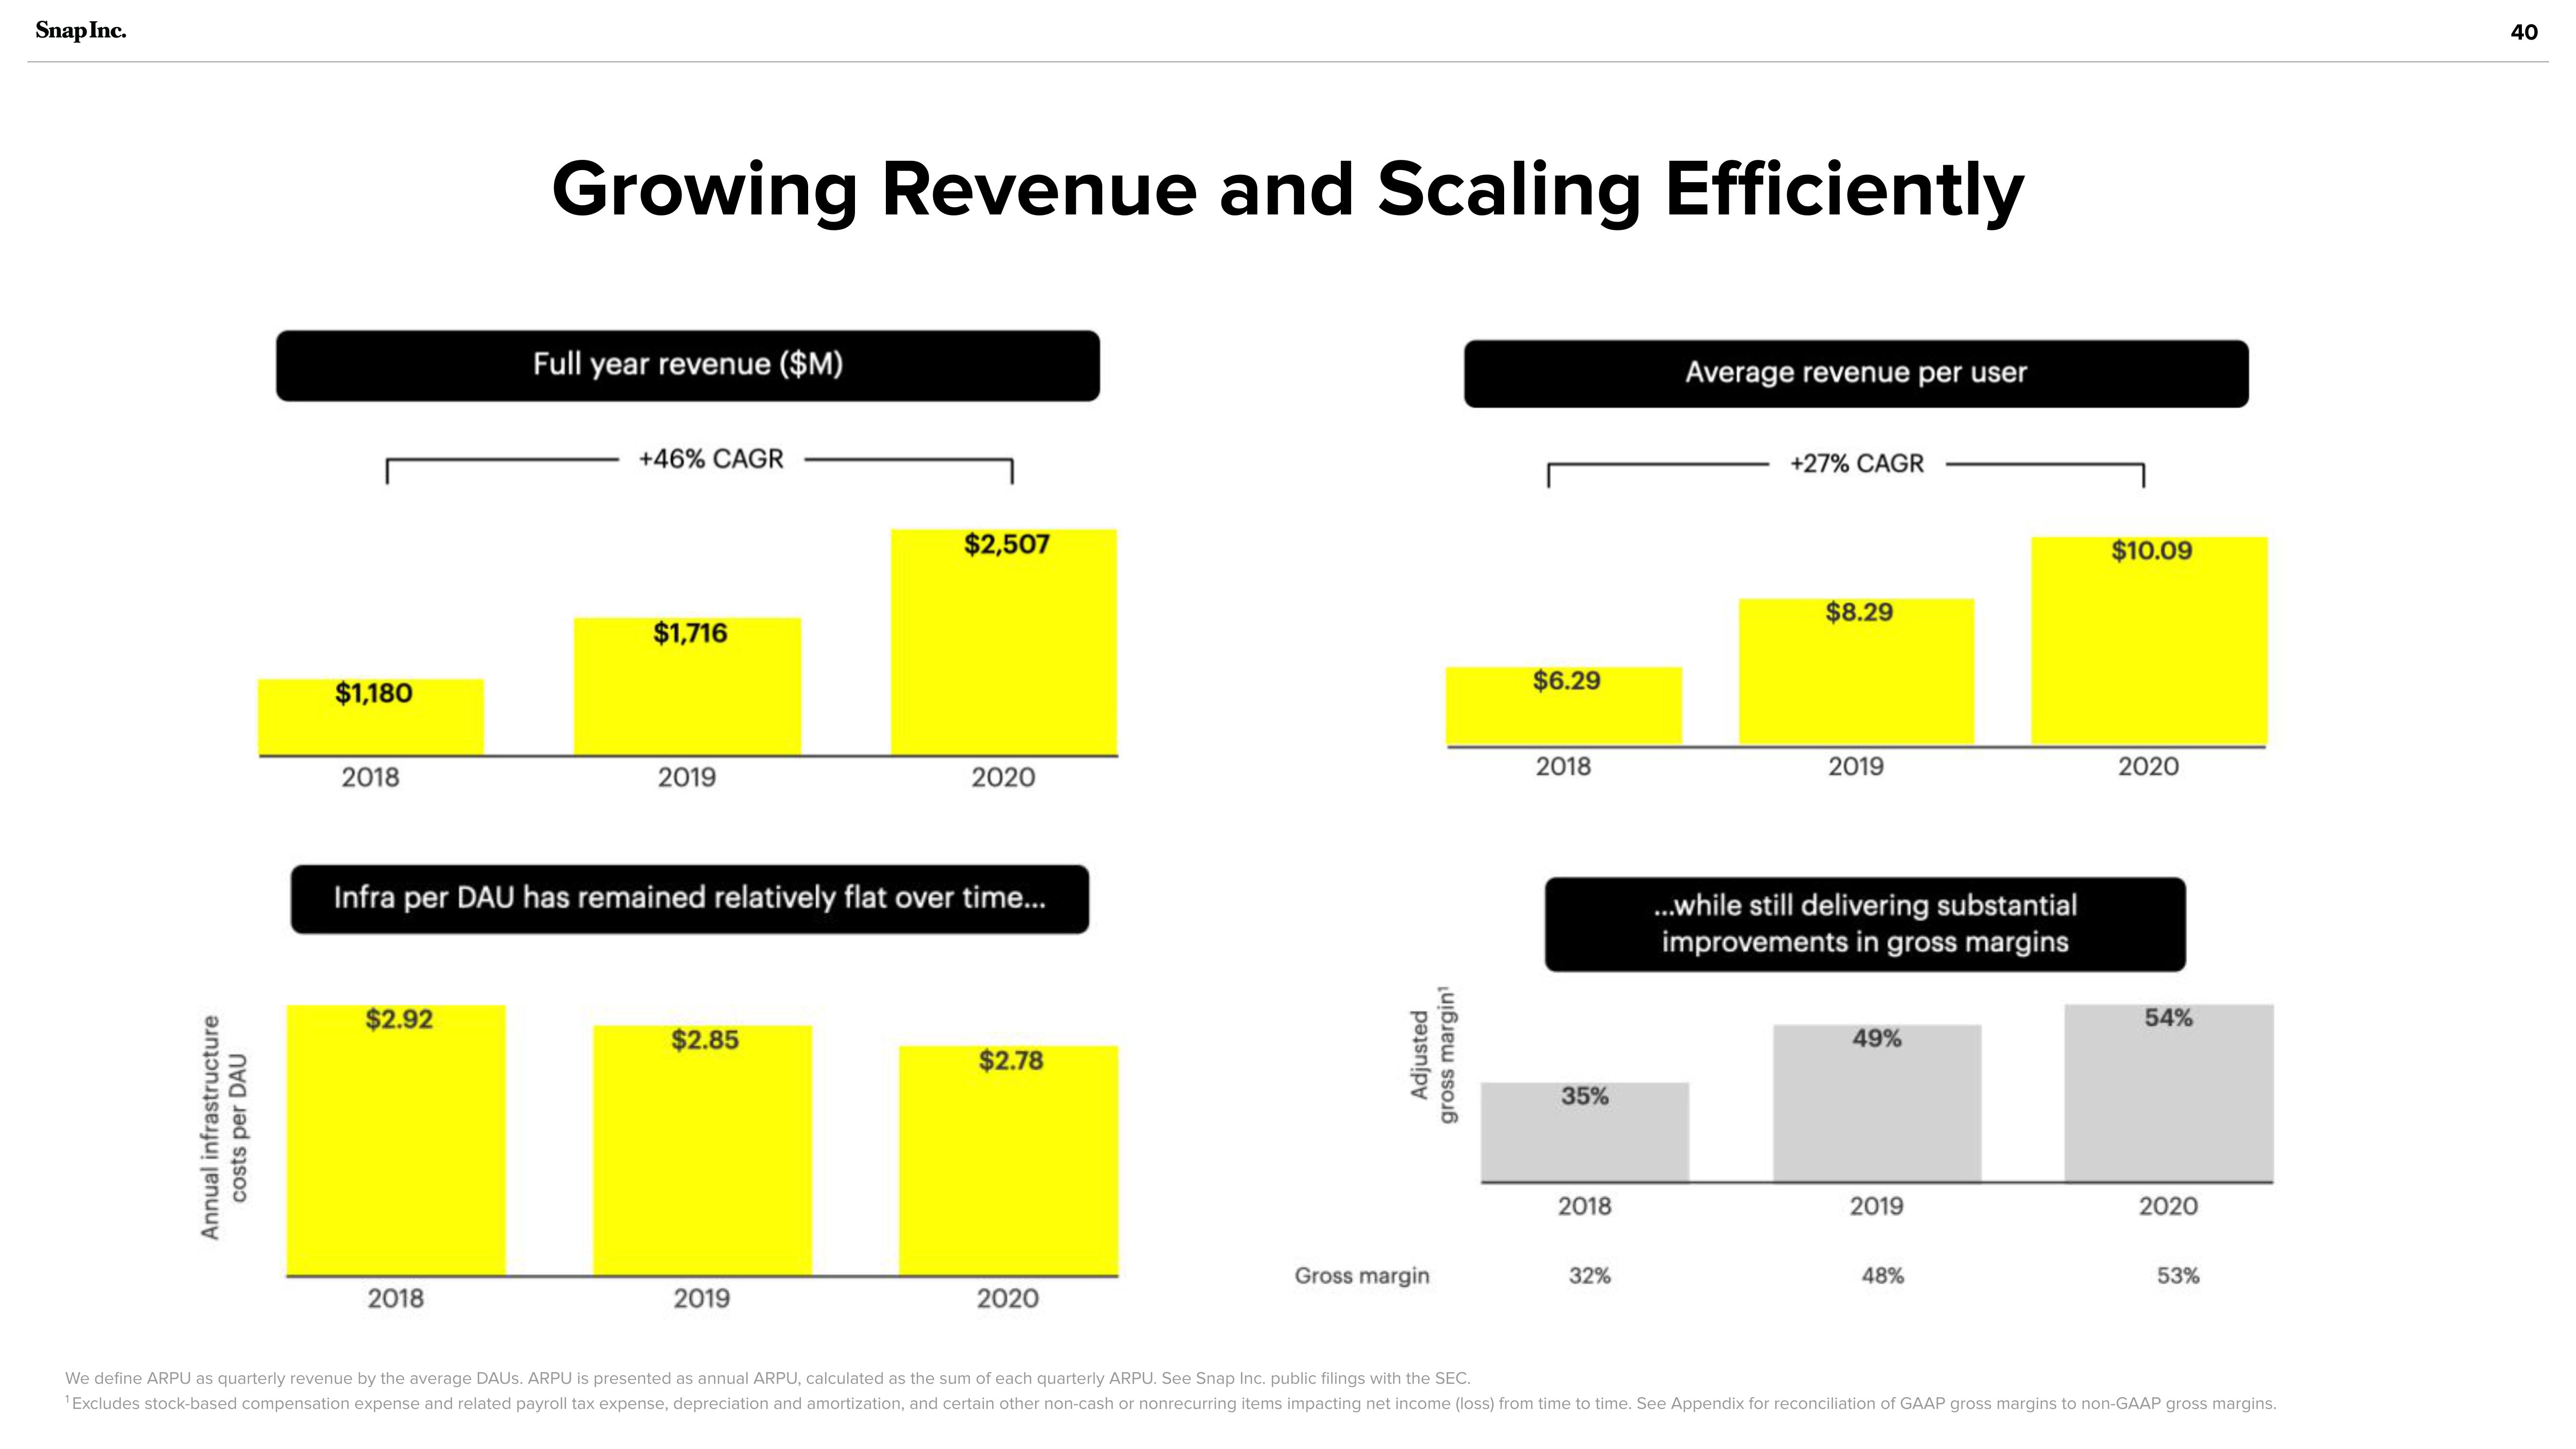
Growing Revenue and Scaling Efficiently
2018
Full year revenue ($M)
+46% CAGR
$1,716
2019
Infra per DAU has remained relatively flat over time...
$2.85
$2,507
2019
2020
$2.78
2020
Adjusted
gross margin¹
Gross margin
$6.29
2018
35%
2018
32%
Average revenue per user
+27% CAGR
$8.29
2019
...while still delivering substantial
improvements in gross margins
49%
2019
48%
$10.09
2020
54%
2020
53%
We define ARPU as quarterly revenue by the average DAUS. ARPU is presented as annual ARPU, calculated as the sum of each quarterly ARPU. See Snap Inc. public filings with the SEC.
¹ Excludes stock-based compensation expense and related payroll tax expense, depreciation and amortization, and certain other non-cash or nonrecurring items impacting net income (loss) from time to time. See Appendix for reconciliation of GAAP gross margins to non-GAAP gross margins.
40View entire presentation