Credit Suisse Results Presentation Deck
Group Overview
Rev.
8
PCL/Costs
Profitability
Balance
Sheet
Credit Suisse Group in CHF mn
Net revenues
Adjusted net revenues
Provision for credit losses
Adjusted provision for credit losses
Operating expenses
Adjusted operating expenses
Pre-tax income/(loss)
Adjusted pre-tax income/ (loss)
Income tax expense
Net income/(loss)
attributable to shareholders
Return on tangible equity
Cost/income ratio
Risk-weighted assets in CHF bn
Leverage exposure in CHF bn
Liquidity coverage ratio²
3Q22
3,804
3,798
21
21
4,125
3,869
(342)
(92)
3,698
(4,034)
(38.3)%
108%
274
837
192%
2Q22
3,645
3,820
64
64
4,754
4,198
(1,173)
(442)
419
(1,593)
(15.0)%
130%
274
863
191%
3Q21
5,437
5,504
(144)
44
4,573
4,098
1,008
1,362
570
434
4.5%
84%
278
937
221%
A 2022
4%
(1) %
(13)%
(8)%
n/m
n/m
n/m
0%
(3)%
A 3Q21
(30)%
(31)%
(10)%
(6) %
n/m
n/m
n/m
(2)%
(11)%
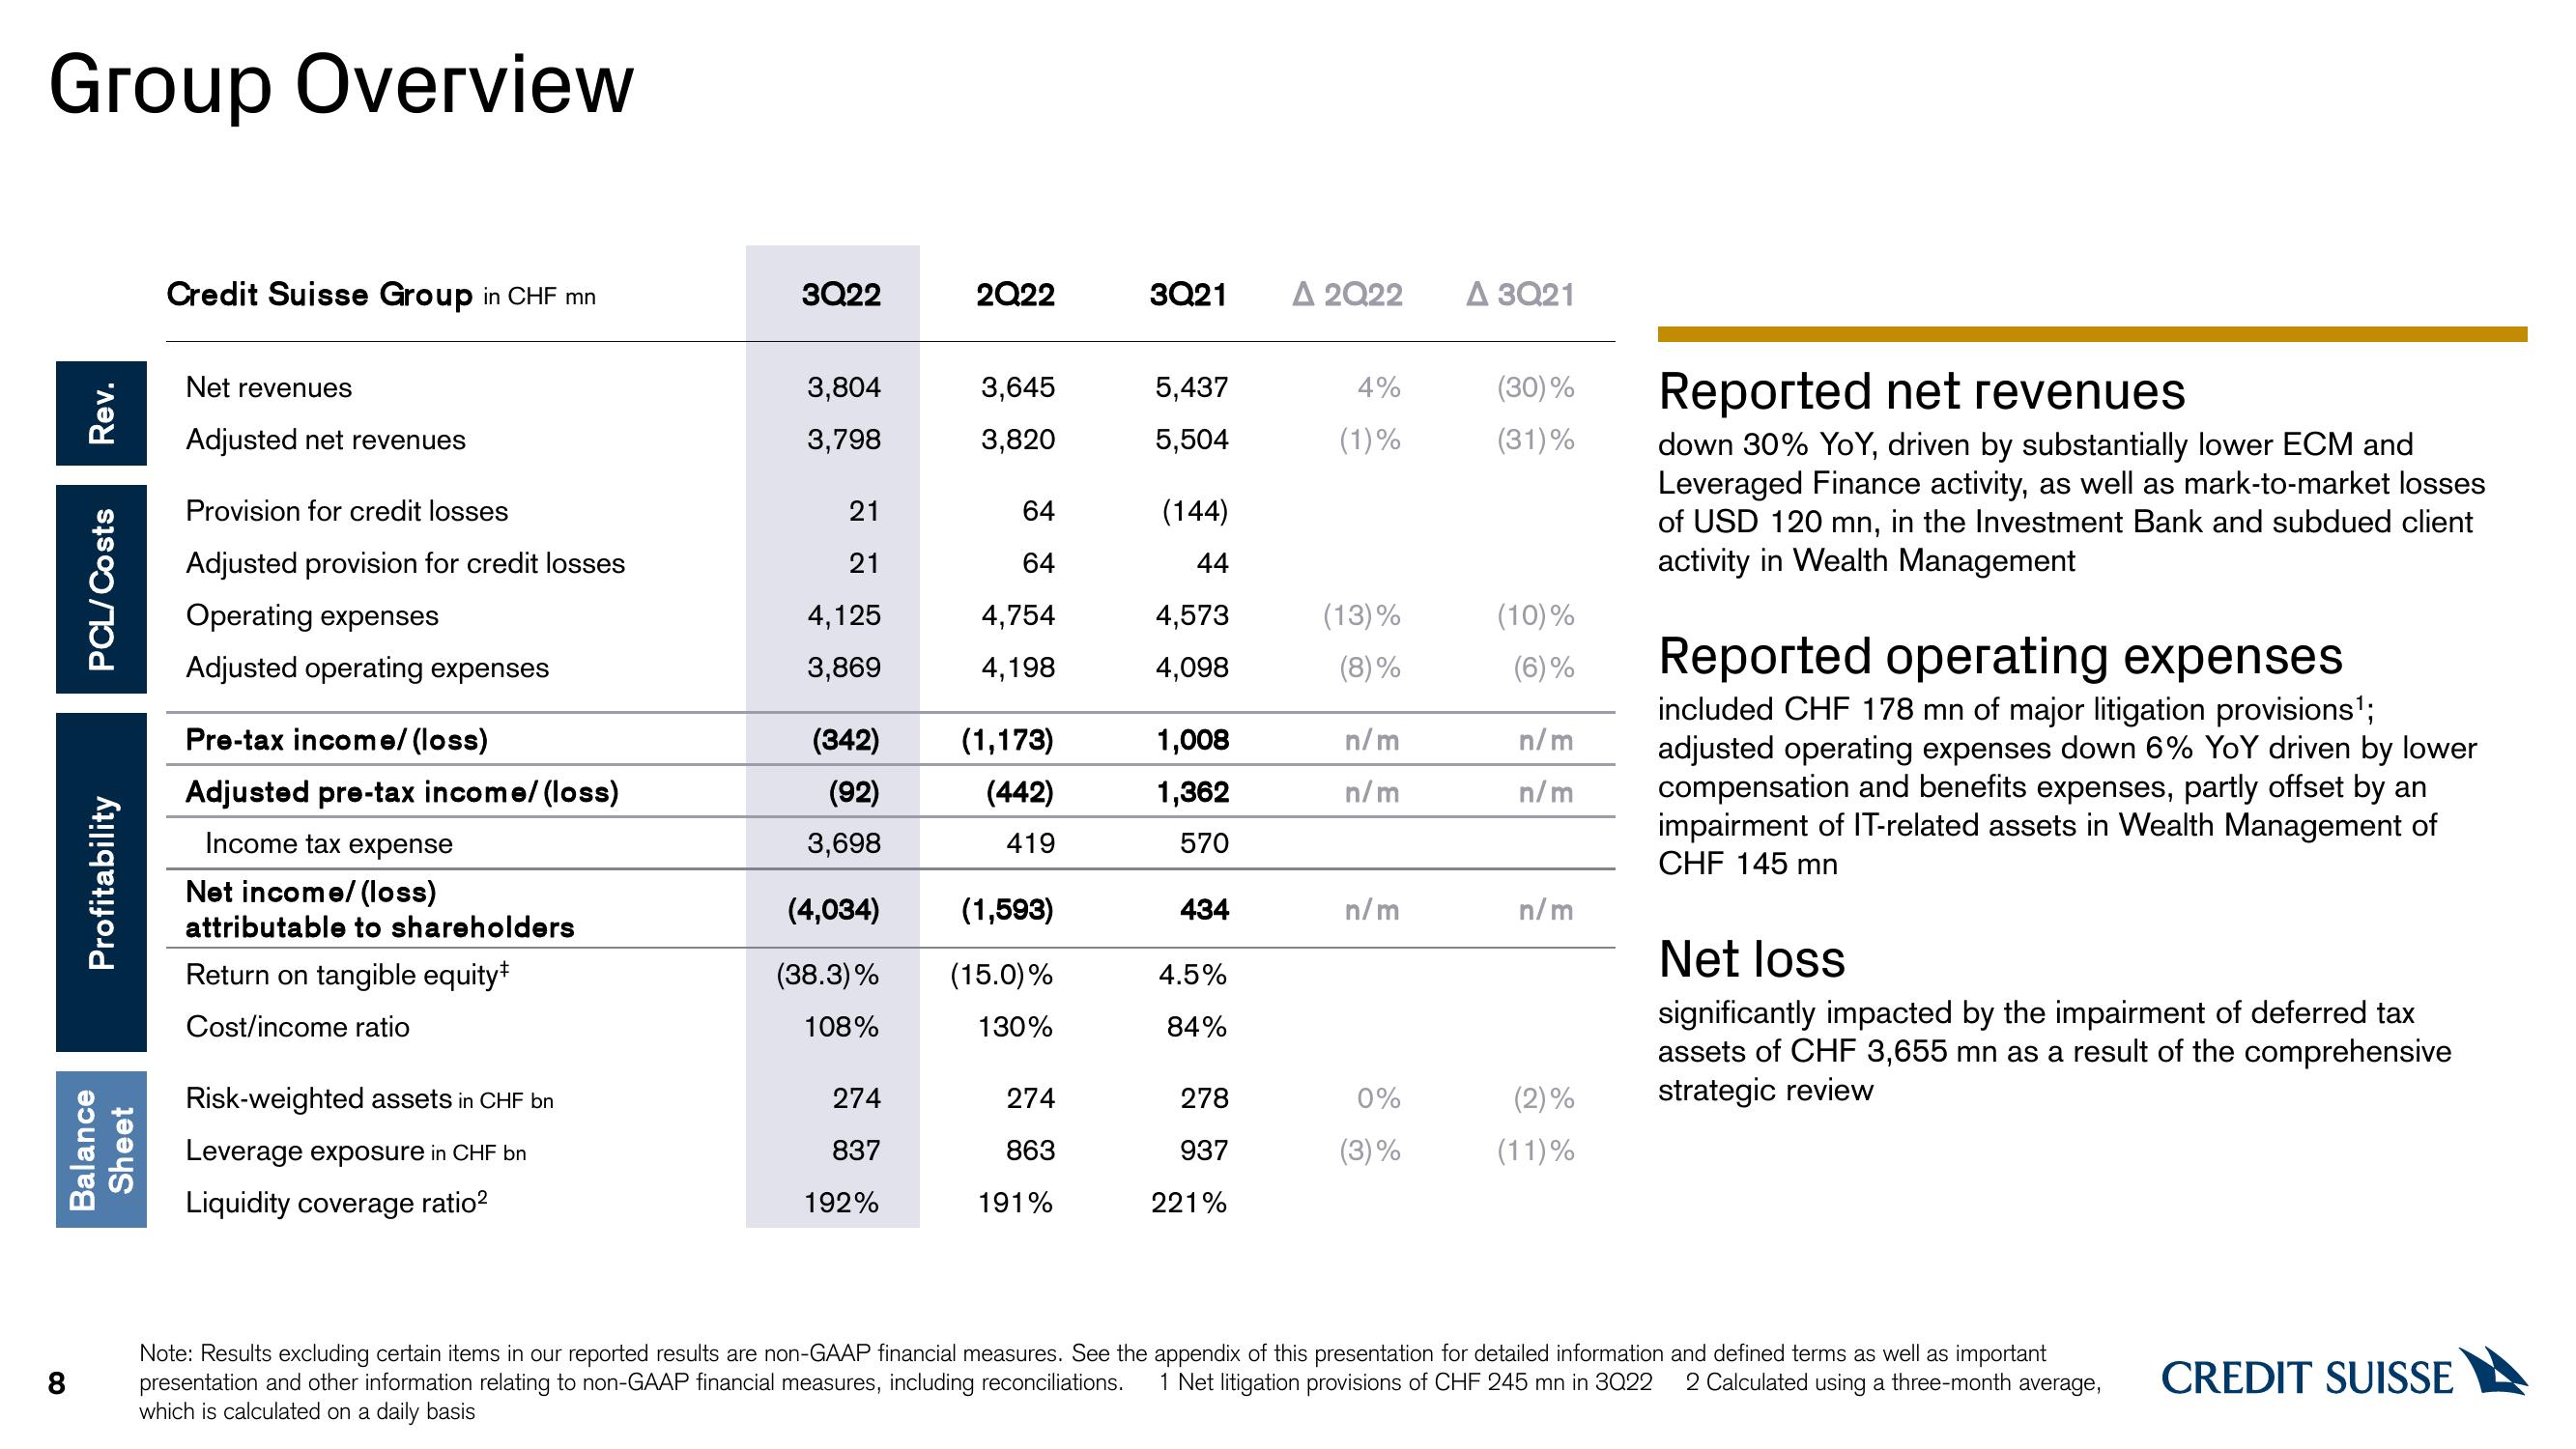
Reported net revenues
down 30% YoY, driven by substantially lower ECM and
Leveraged Finance activity, as well as mark-to-market losses
of USD 120 mn, in the Investment Bank and subdued client
activity in Wealth Management
Reported operating expenses
included CHF 178 mn of major litigation provisions¹;
adjusted operating expenses down 6% YoY driven by lower
compensation and benefits expenses, partly offset by an
impairment of IT-related assets in Wealth Management of
CHF 145 mn
Net loss
significantly impacted by the impairment of deferred tax
assets of CHF 3,655 mn as a result of the comprehensive
strategic review
Note: Results excluding certain items in our reported results are non-GAAP financial measures. See the appendix of this presentation for detailed information and defined terms as well as important
presentation and other information relating to non-GAAP financial measures, including reconciliations. 1 Net litigation provisions of CHF 245 mn in 3022 2 Calculated using a three-month average,
which is calculated on a daily basis
CREDIT SUISSEView entire presentation