Altus Power Results Presentation Deck
Statement of
Operations
tox
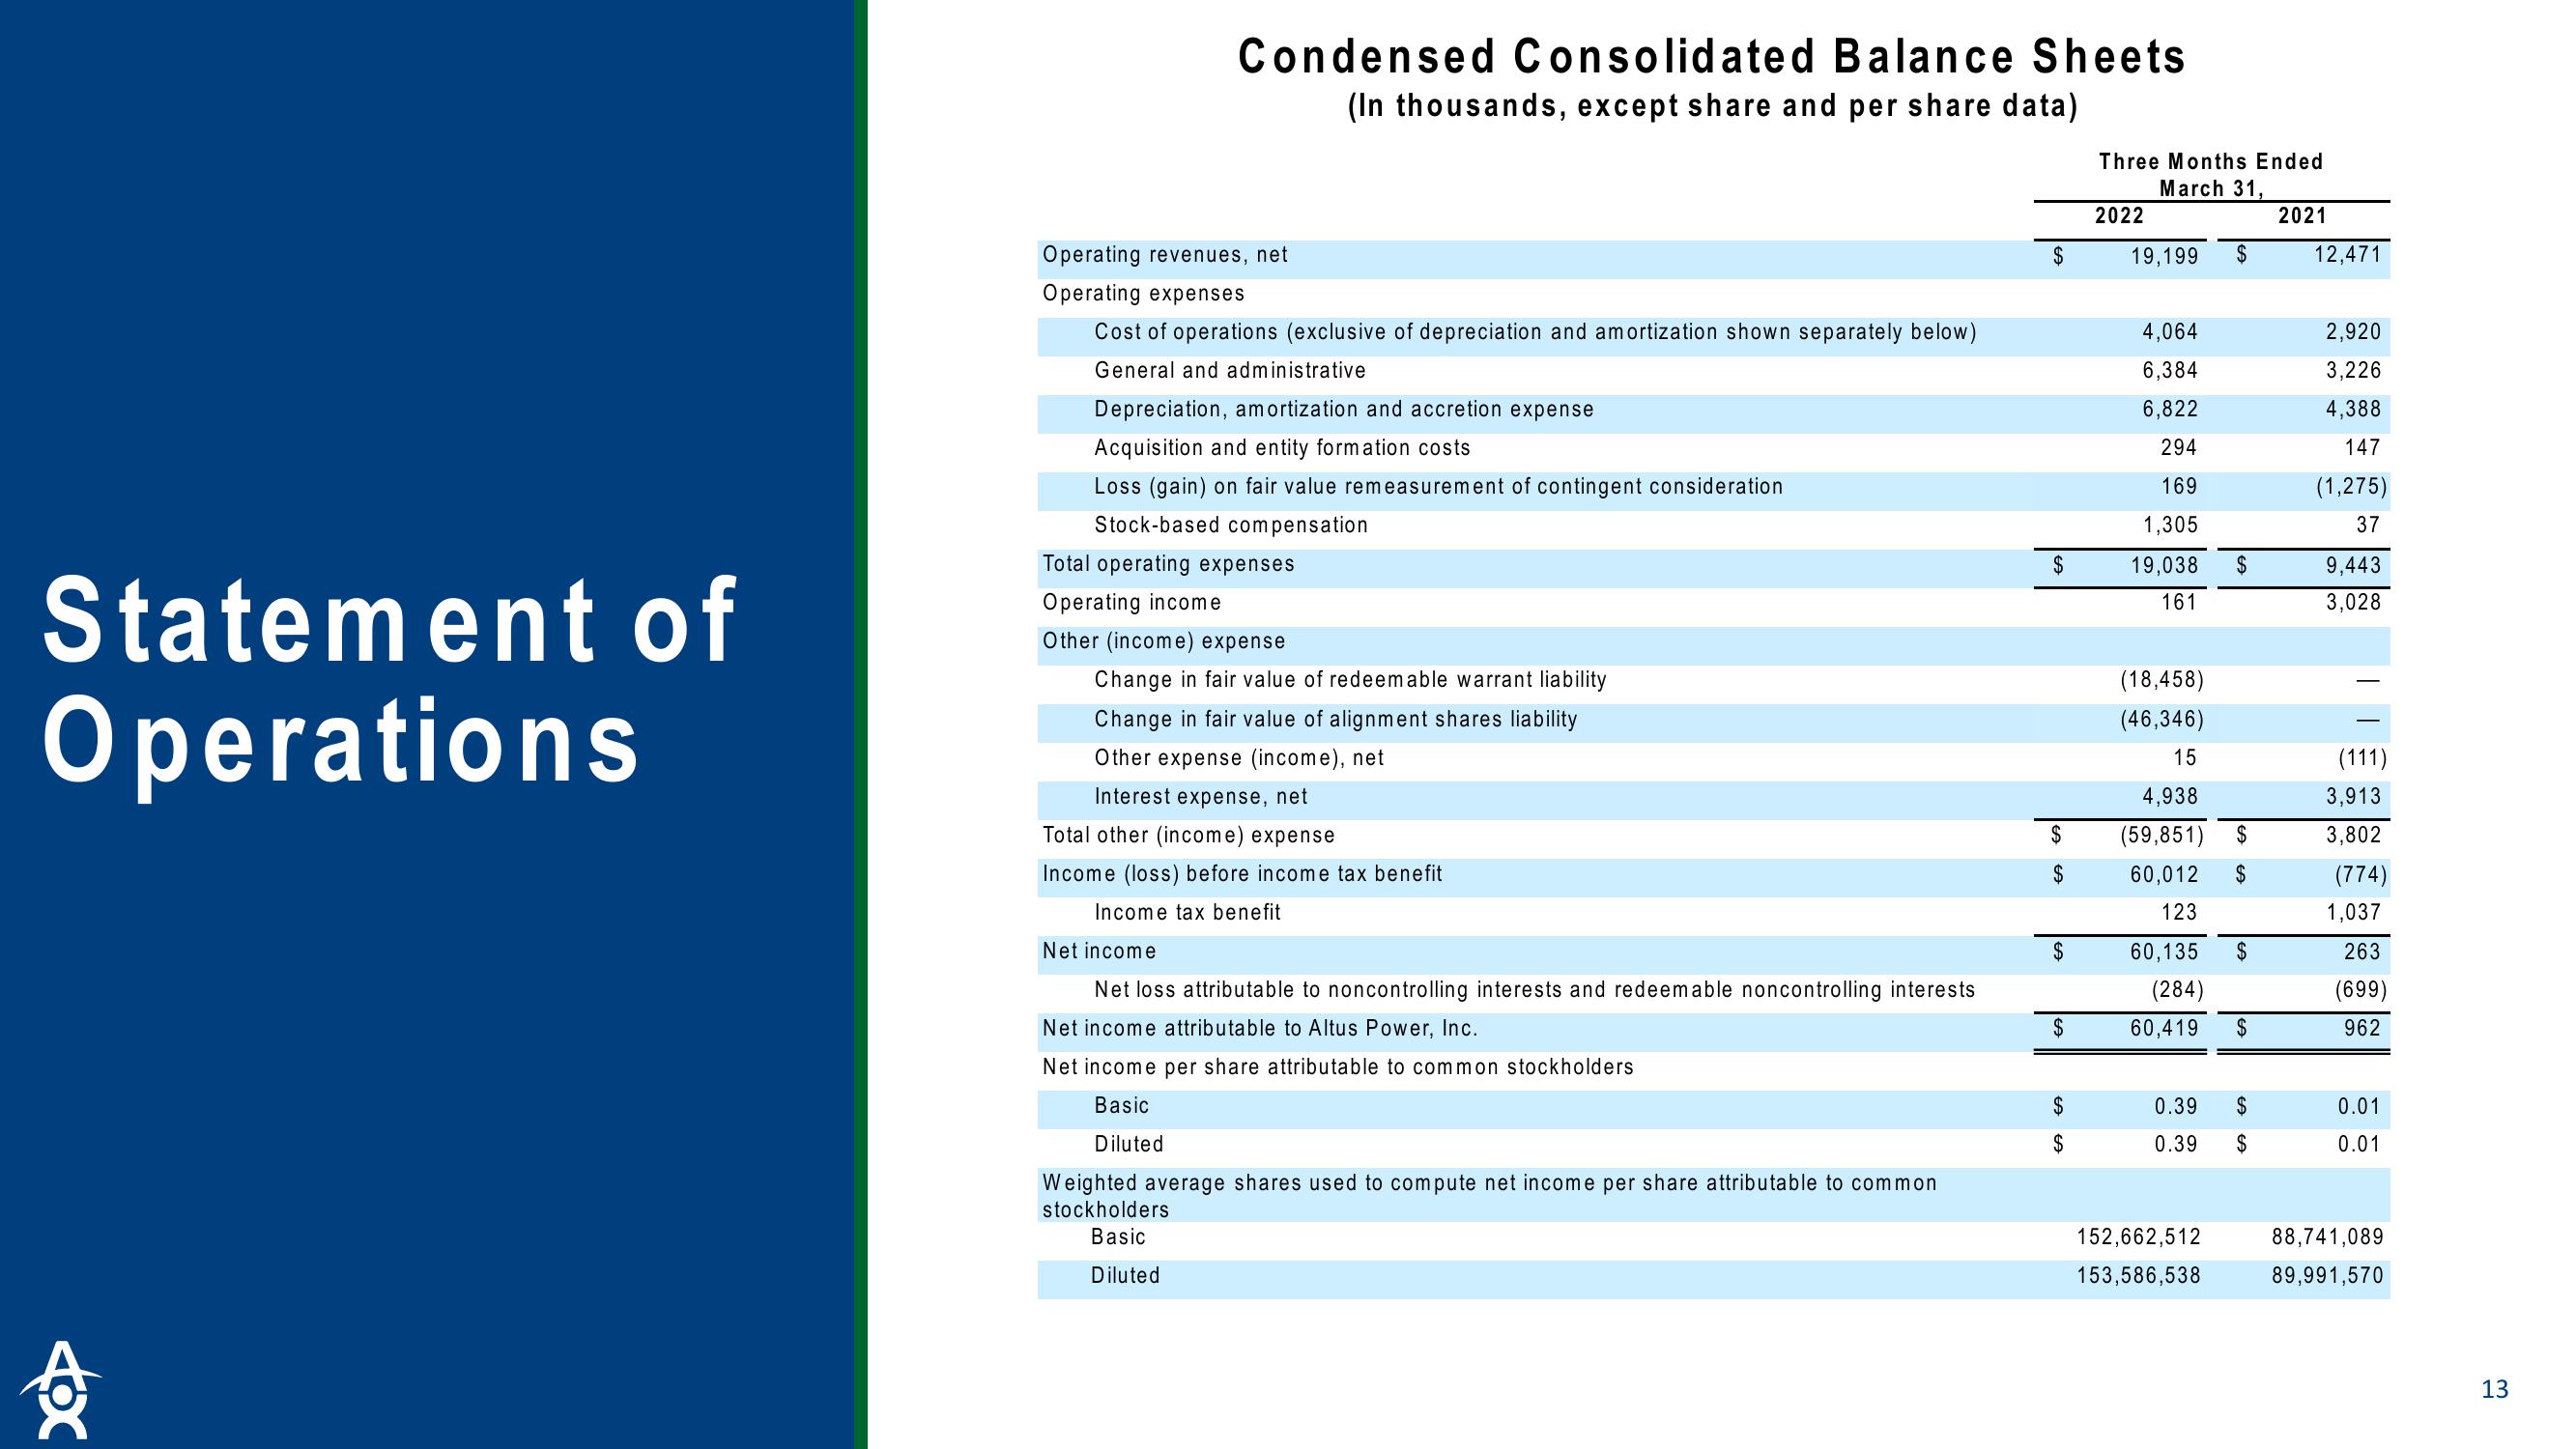
Condensed Consolidated Balance Sheets
(In thousands, except share and per share data)
Operating revenues, net
Operating expenses
Cost of operations (exclusive of depreciation and amortization shown separately below)
General and administrative
Depreciation, amortization and accretion expense
Acquisition and entity for atic costs
Loss (gain) on fair value remeasurement of contingent consideration
Stock-based compensation
Total operating expenses
Operating income
Other (income) expense
Change in fair value of redeemable warrant liability
Change in fair value of alignment shares liability
Other expense (income), net
Interest expense, net
Total other (income) expense
Income (loss) before income tax benefit
Income tax benefit
Net income
Net loss attributable to noncontrolling interests and redeemable noncontrolling interests
Net income attributable to Altus Power, Inc.
Net income per share attributable to common stockholders
Basic
Diluted
Weighted average shares used to compute net income per share attributable to common
stockholders
Basic
Diluted
$
$
$
$
$
$
$
$
Three Months Ended
March 31,
2022
19,199 $
4,064
6,384
6,822
294
169
1,305
19,038 $
161
(18,458)
(46,346)
15
4,938
(59,851)
$
60,012 $
123
60,135
(284)
60,419
$
152,662,512
153,586,538
$
$
0.39
0.39 $
2021
12,471
2,920
3,226
4,388
147
(1,275)
37
9,443
3,028
(111)
3,913
3,802
(774)
1,037
263
(699)
962
0.01
0.01
88,741,089
89,991,570
13View entire presentation