Credit Suisse Results Presentation Deck
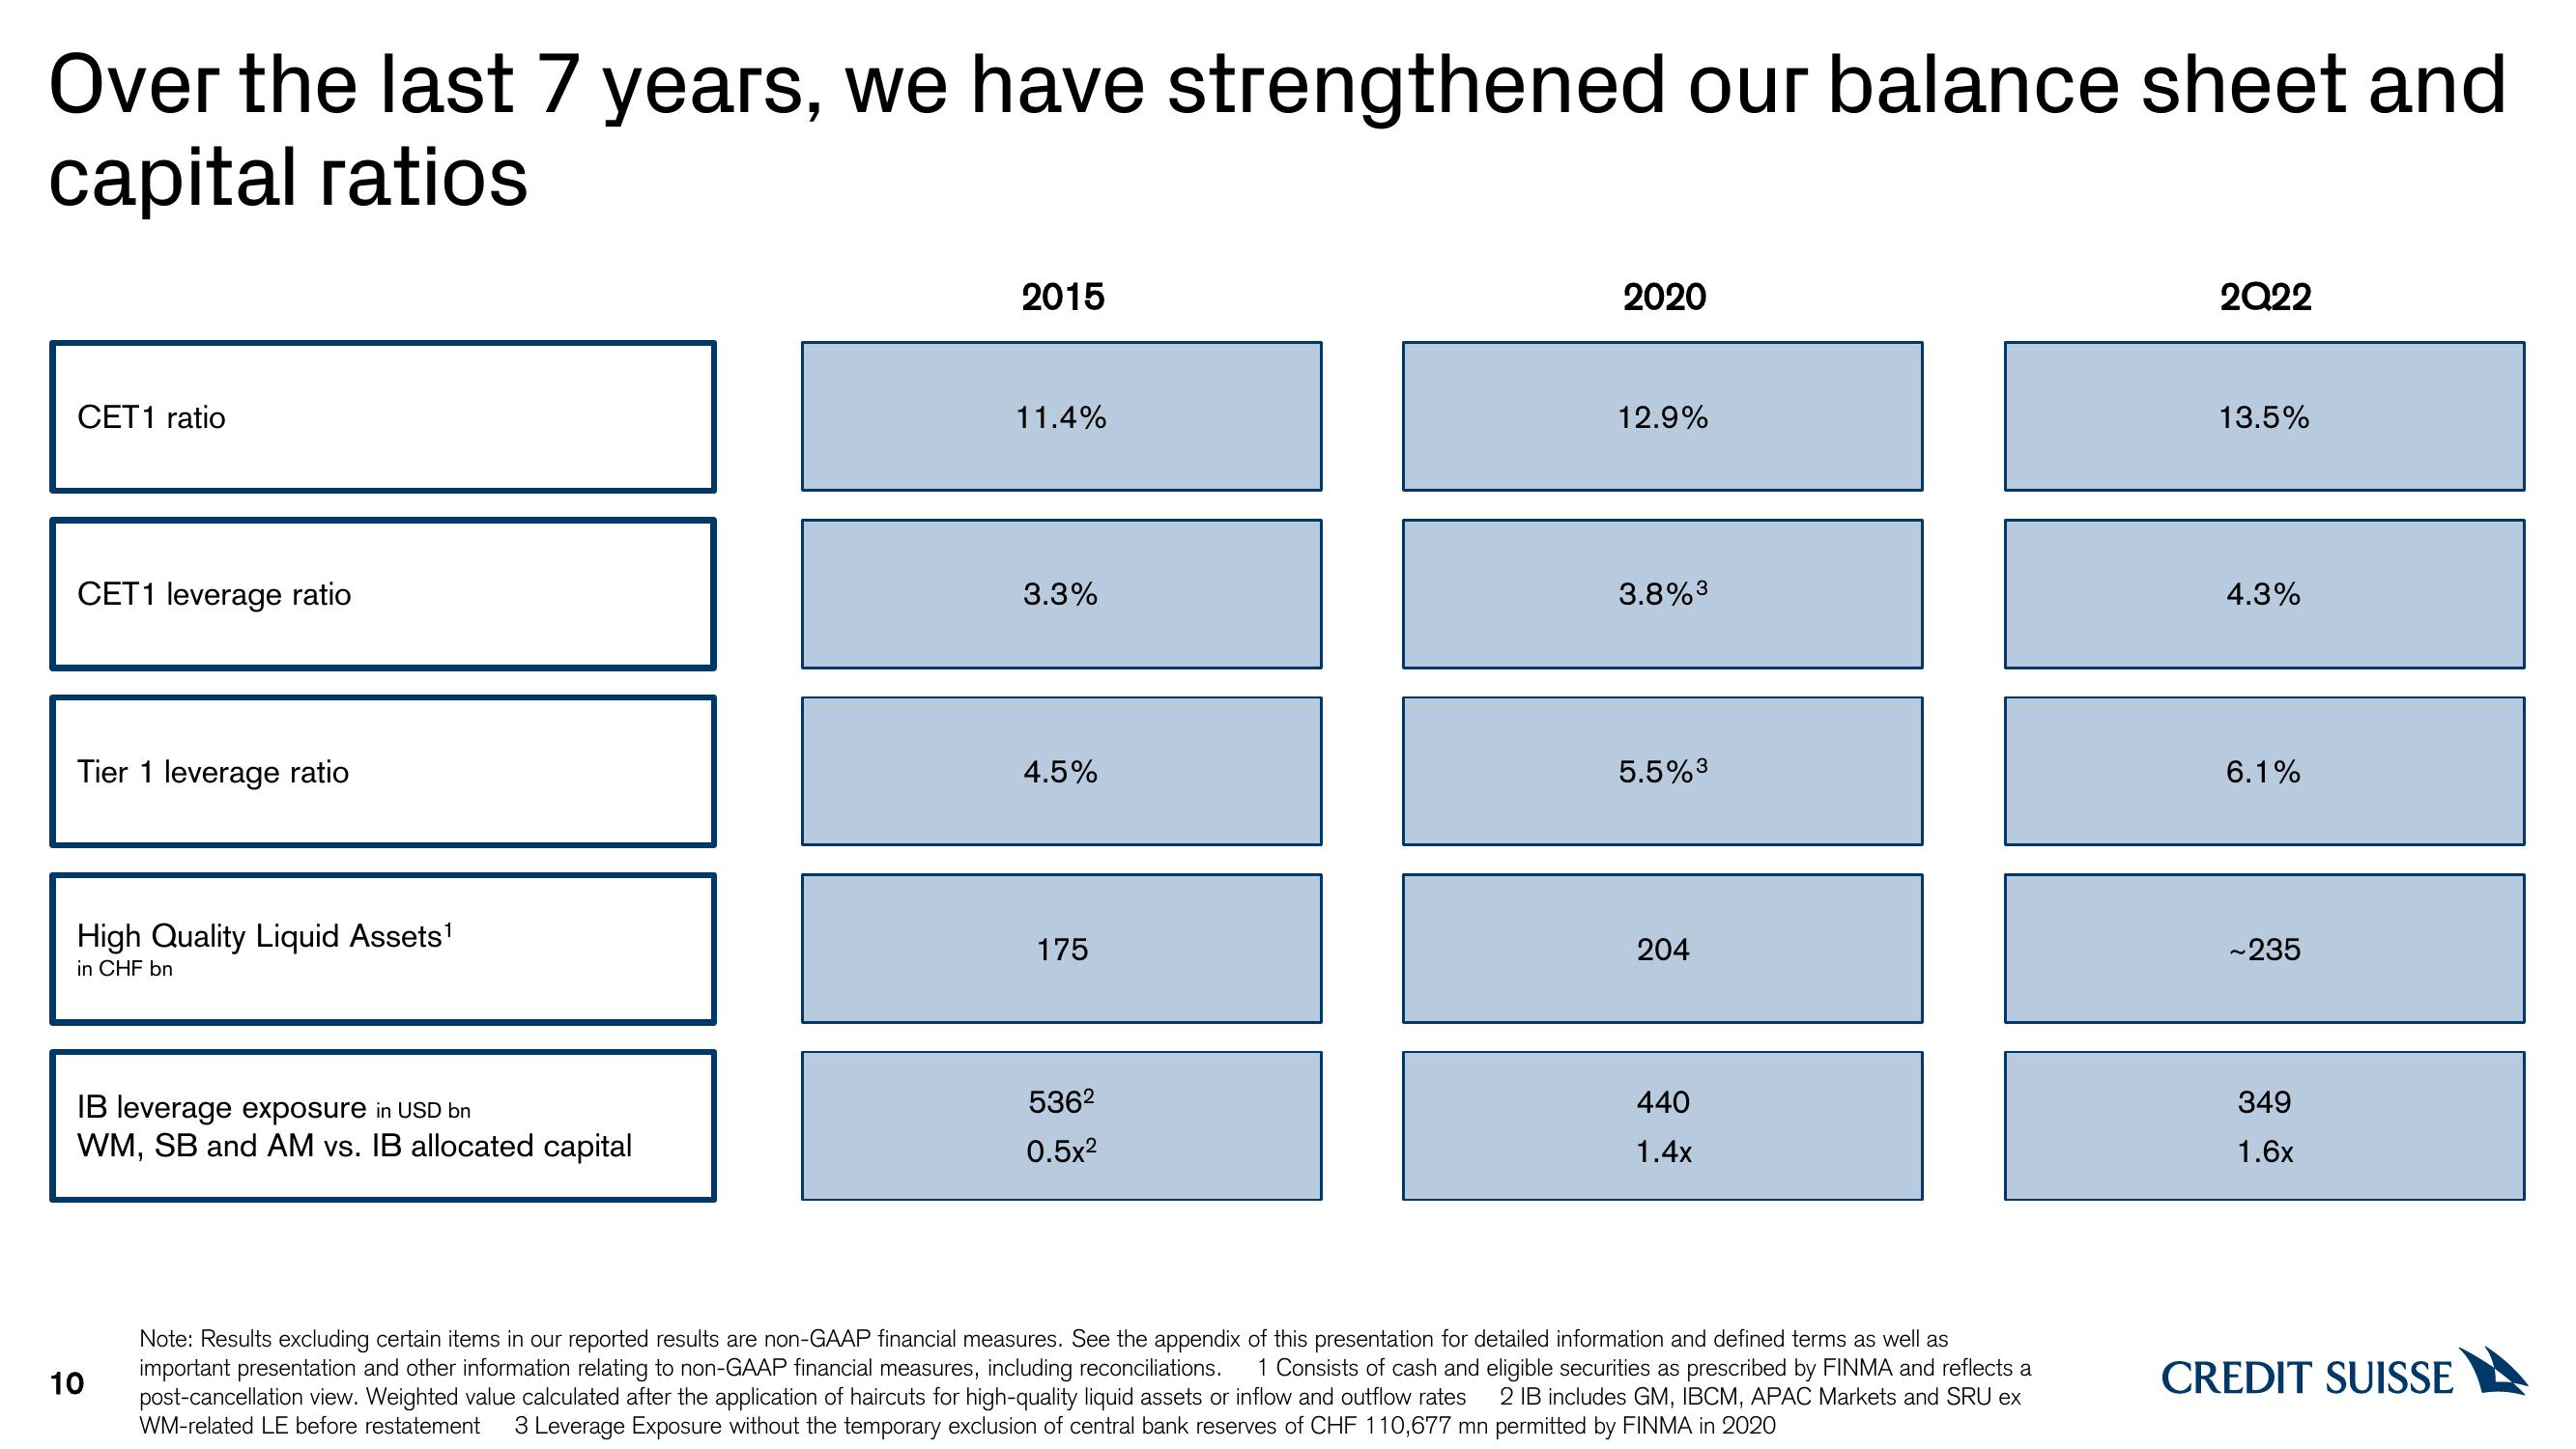
Over the last 7 years, we have strengthened our balance sheet and
capital ratios
CET1 ratio
CET1 leverage ratio
Tier 1 leverage ratio
High Quality Liquid Assets¹
in CHF bn
IB leverage exposure in USD bn
WM, SB and AM vs. IB allocated capital
10
2015
11.4%
3.3%
4.5%
175
536²
0.5x2
2020
12.9%
3.8%³
5.5%³
204
440
1.4x
Note: Results excluding certain items in our reported results are non-GAAP financial measures. See the appendix of this presentation for detailed information and defined terms as well as
important presentation and other information relating to non-GAAP financial measures, including reconciliations. 1 Consists of cash and eligible securities as prescribed by FINMA and reflects a
post-cancellation view. Weighted value calculated after the application of haircuts for high-quality liquid assets or inflow and outflow rates 2 IB includes GM, IBCM, APAC Markets and SRU ex
WM-related LE before restatement 3 Leverage Exposure without the temporary exclusion of central bank reserves of CHF 110,677 mn permitted by FINMA in 2020
2022
13.5%
4.3%
6.1%
~235
349
1.6x
CREDIT SUISSEView entire presentation