Barclays Credit Presentation Deck
STRATEGY, TARGETS
& GUIDANCE
Structural hedge
Hedge notional
(£bn)
GBP 5 Year
swap rate¹ (%)
Gross hedge
contribution
(£m)
PERFORMANCE
171
1.5
1.0
Dec-19 Mar-20 Jun-20 Sep-20 Dec-20 Mar-21 Jun-21 Sep-21 Dec-21
0.5
0.0
Q120
174
2016
435
hay
ASSET QUALITY
431
2017 2018 2019
-Zero Yield Close
Q220 Q320 Q420
28 | Barclays Q4 2021 Results | 23 February 2022
174 181 188 192 198
407
¹ UK Pound Sterling SONIA OIS Zero 5 Year Point (Refinitiv: GBPOIS5YZ=R) |
CAPITAL
& LEVERAGE
377
350
Structural hedge program update
MREL, FUNDING
& LIQUIDITY
224 228
2020 2021
5 Year Moving Average
341
Q121 Q221 Q321 Q421
353
2022
371
.
CREDIT RATINGS
ESG
-
DIVISIONS
& LEGAL ENTITIES
APPENDIX
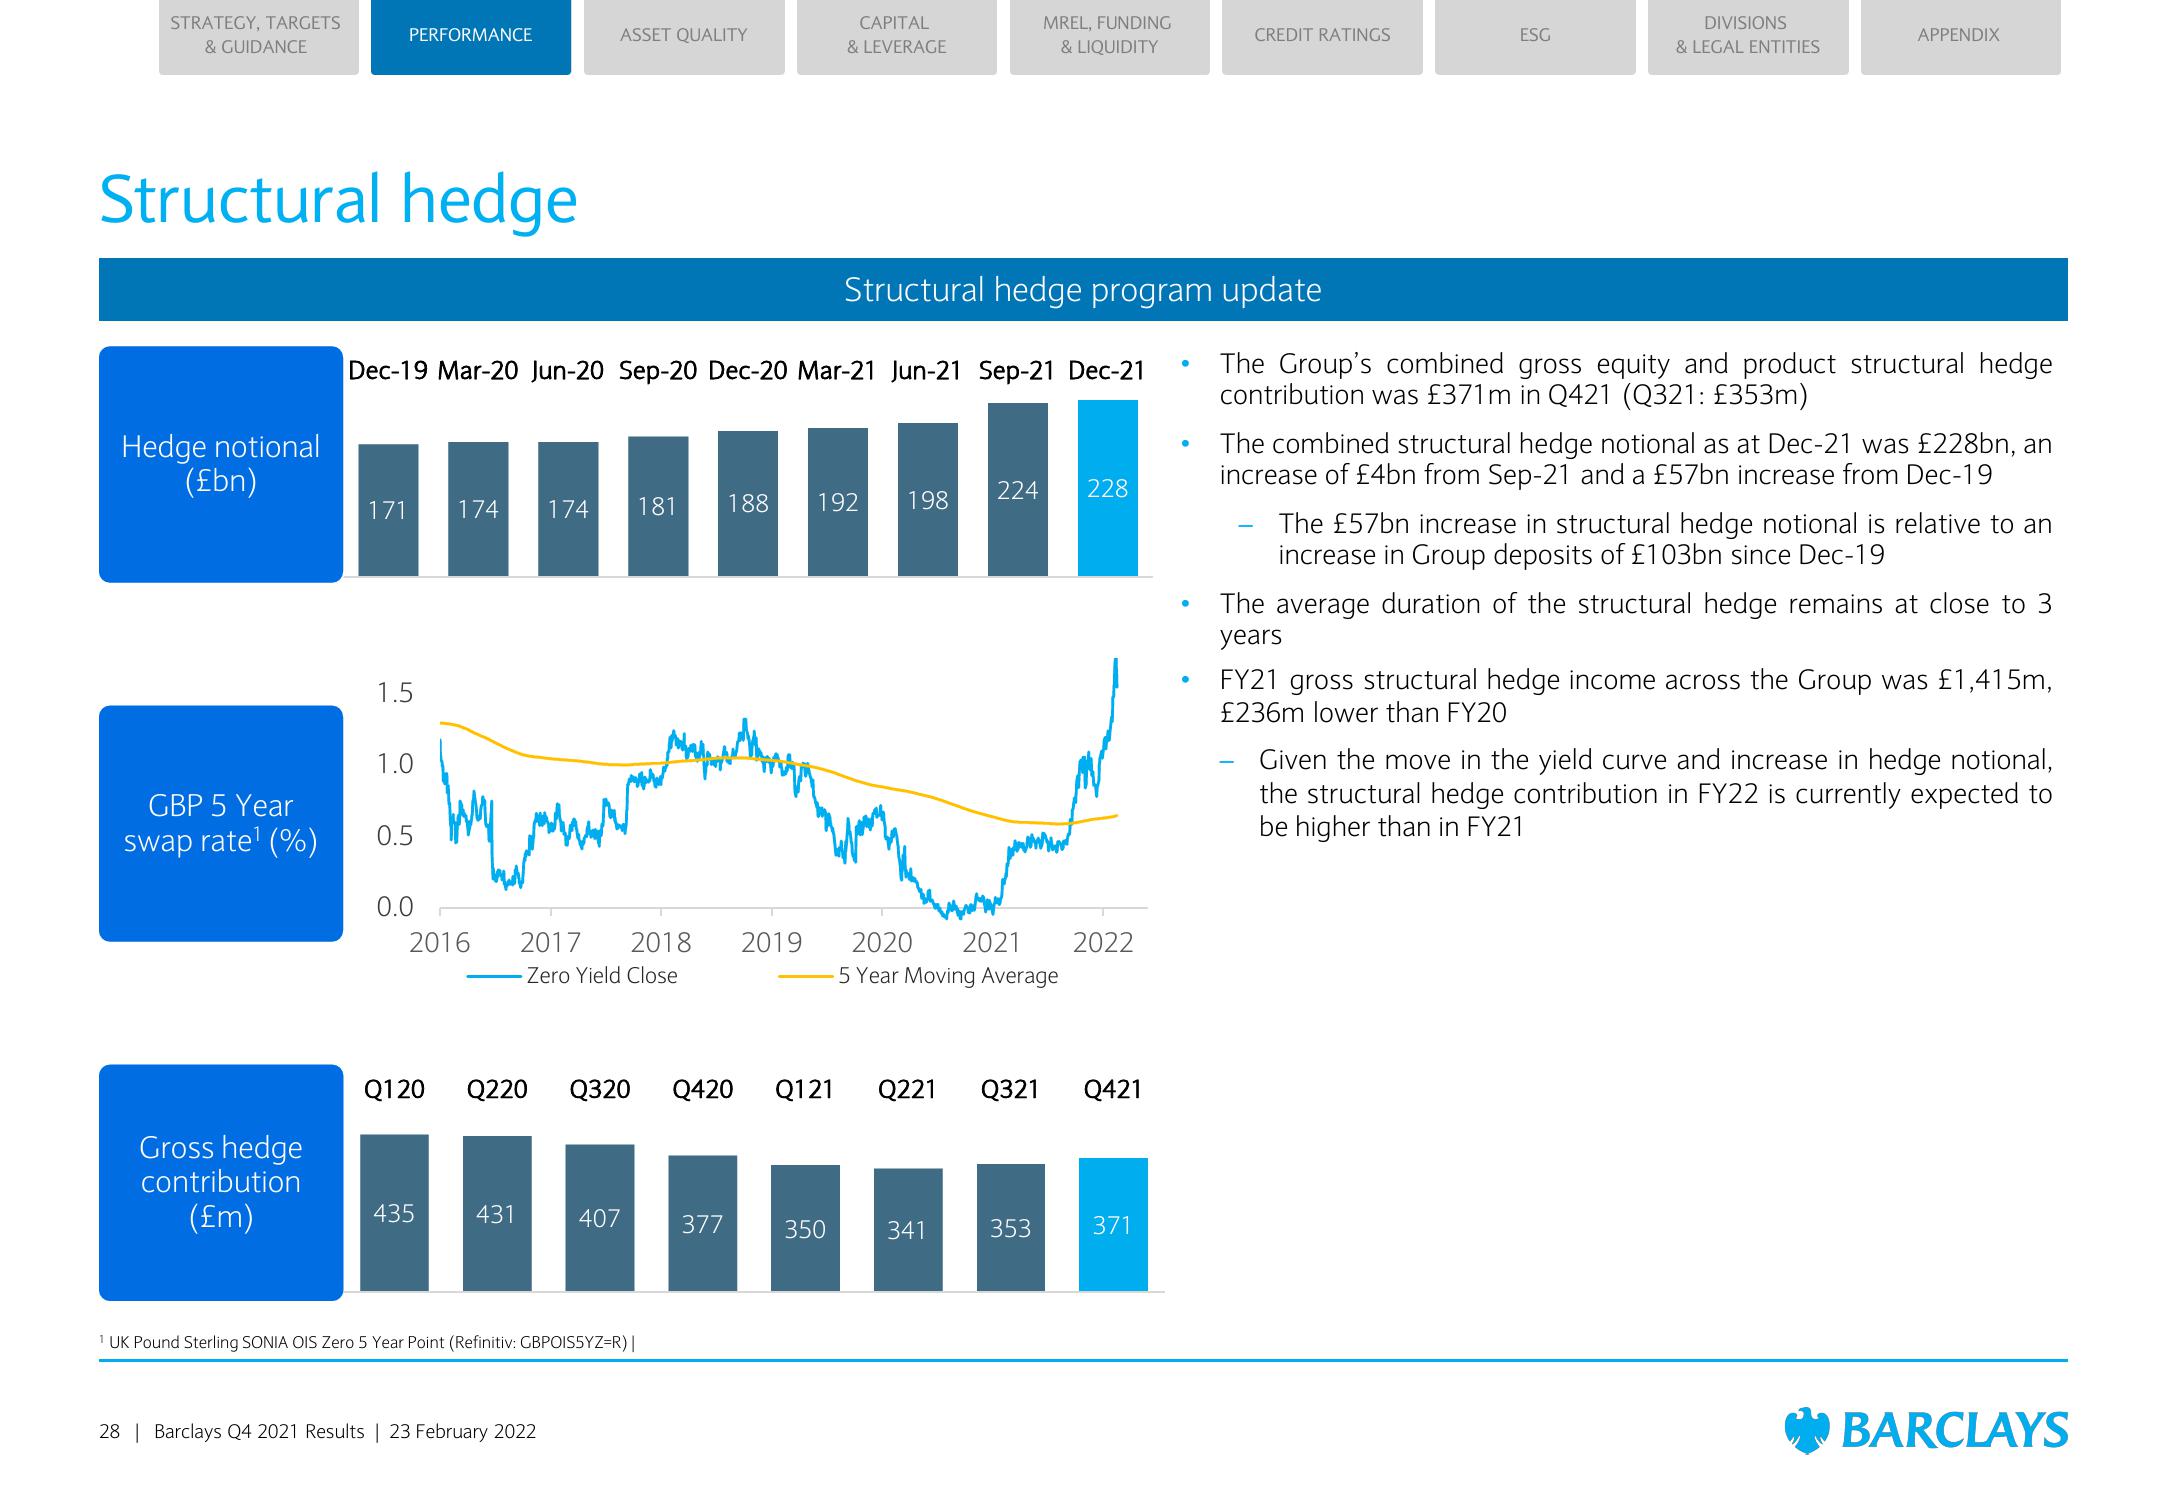
The Group's combined gross equity and product structural hedge
contribution was £371m in Q421 (Q321: £353m)
The combined structural hedge notional as at Dec-21 was £228bn, an
increase of £4bn from Sep-21 and a £57bn increase from Dec-19
The £57bn increase in structural hedge notional is relative to an
increase in Group deposits of £103bn since Dec-19
The average duration of the structural hedge remains at close to 3
years
FY21 gross structural hedge income across the Group was £1,415m,
£236m lower than FY20
Given the move in the yield curve and increase in hedge notional,
the structural hedge contribution in FY22 is currently expected to
be higher than in FY21
BARCLAYSView entire presentation