Tradeweb Results Presentation Deck
U.S. Corporate Bonds
Product
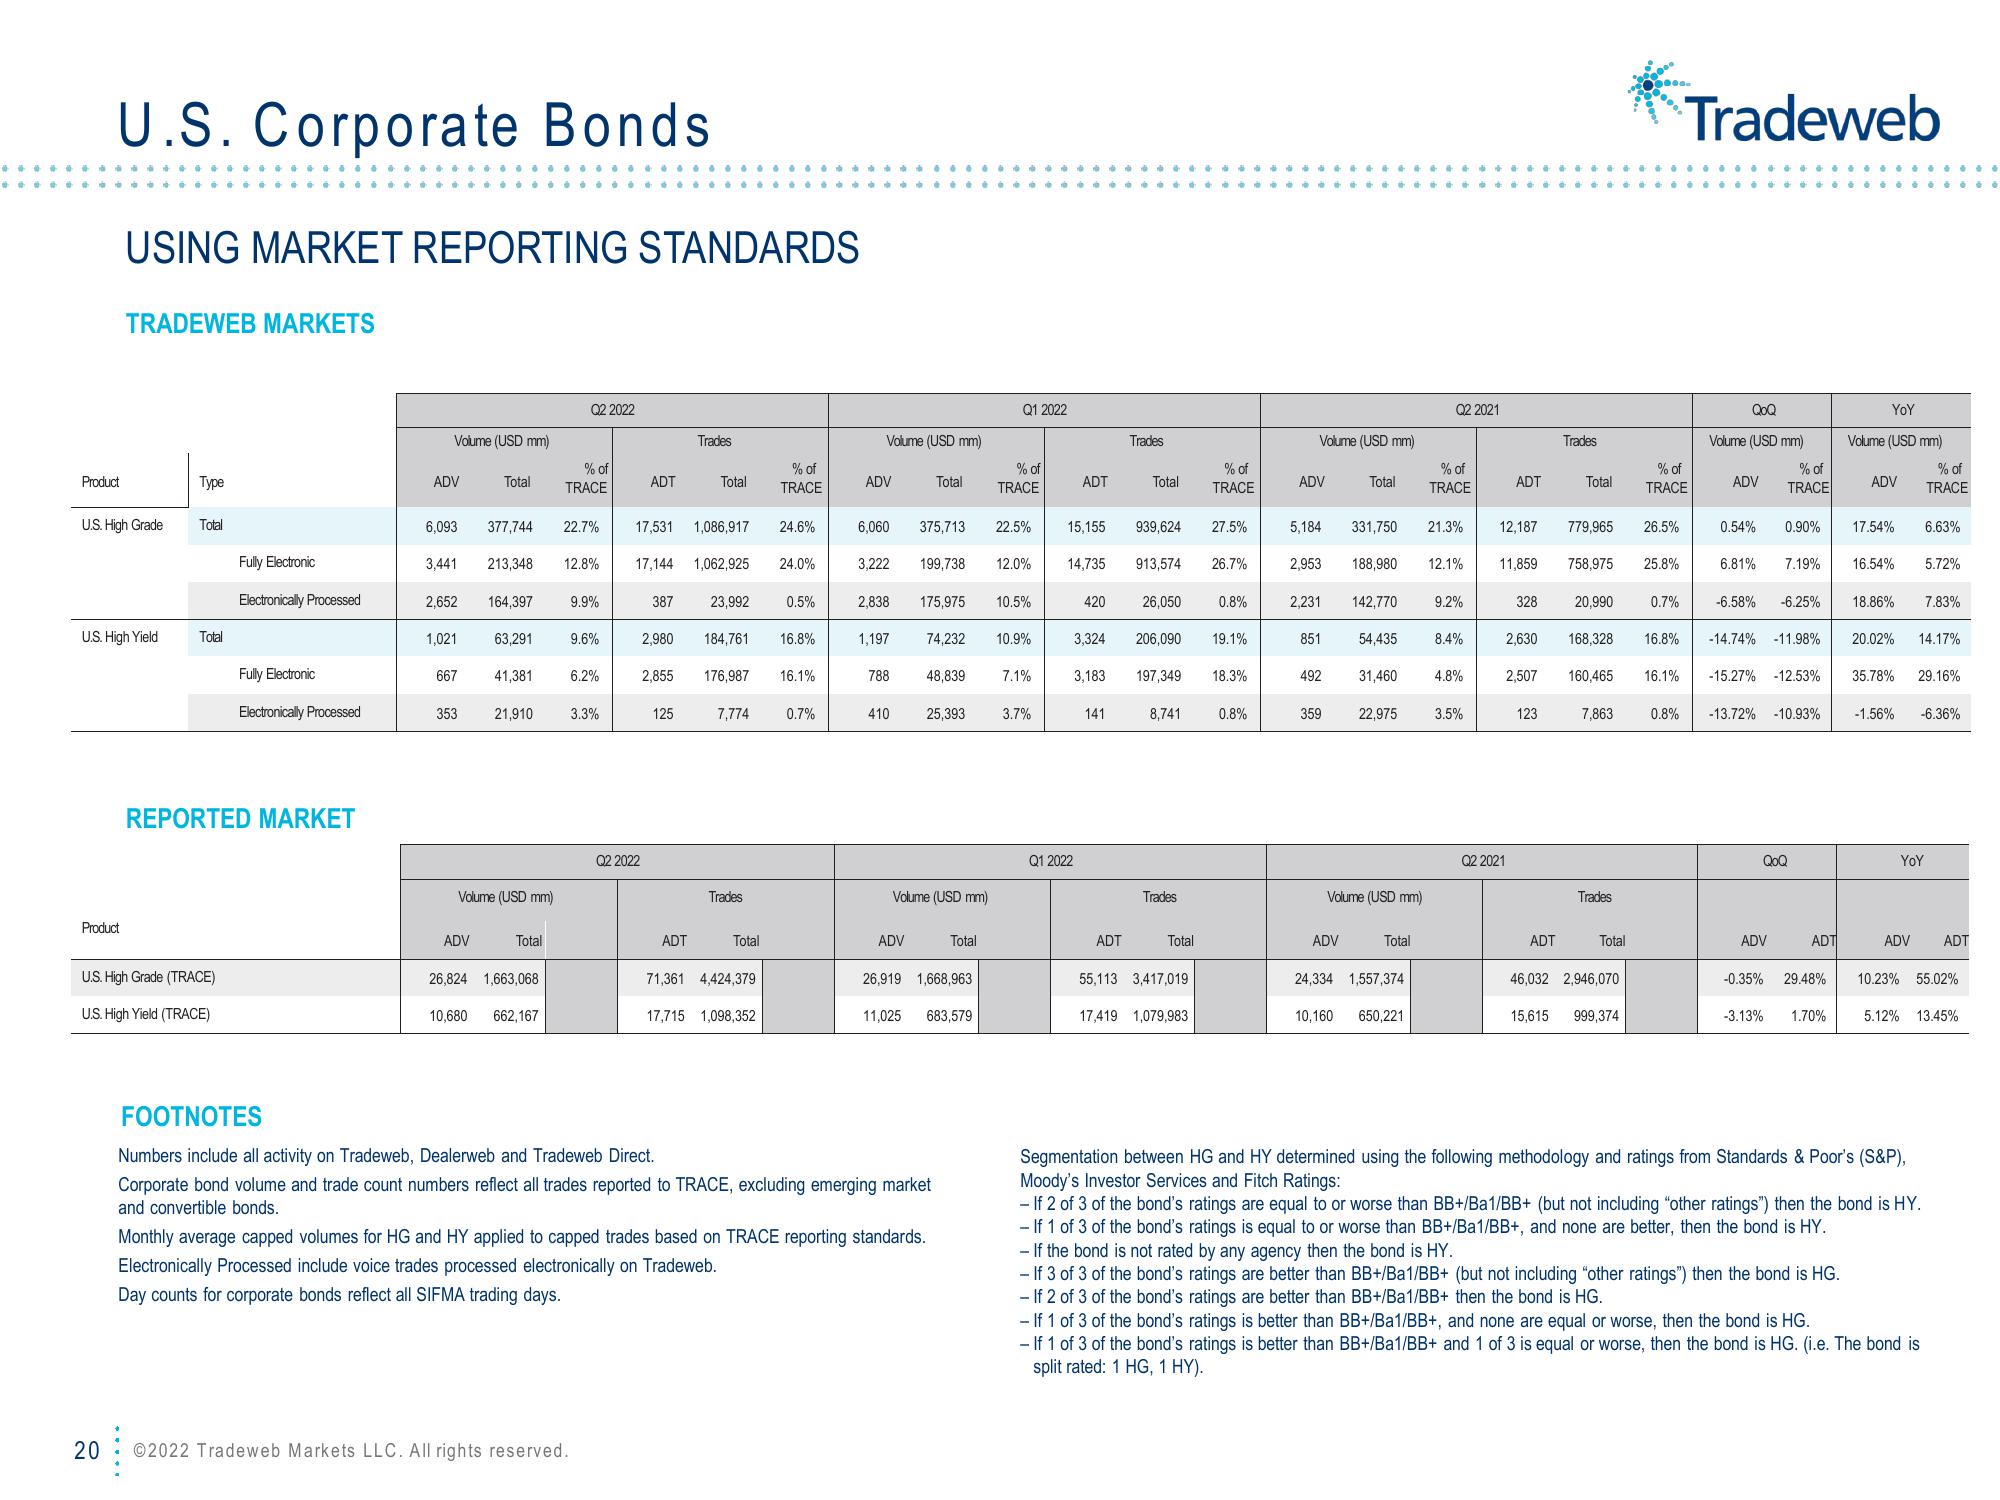
USING MARKET REPORTING STANDARDS
U.S. High Grade
Product
TRADEWEB MARKETS
U.S. High Yield
20
Type
Total
Total
U.S. High Grade (TRACE)
U.S. High Yield (TRACE)
Fully Electronic
Electronically Processed
Fully Electronic
Electronically Processed
REPORTED MARKET
Volume (USD mm)
ADV
6,093
3,441
2,652
1,021
667
353
Total
ADV
164,397
377,744 22.7%
213,348 12.8%
63,291
41,381
Volume (USD mm)
Total
26,824 1,663,068
Q2 2022
% of
TRACE
10,680 662,167
21,910 3.3%
9.9%
9.6%
©2022 Tradeweb Markets LLC. All rights reserved.
6.2%
ADT
387
Q2 2022
17,531 1,086,917
17,144 1,062,925 24.0%
2.855
Trades
125
Total
ADT
23,992
2.980 184,761 16.8%
176,987
7,774
Trades
% of
TRACE
Total
71,361 4,424,379
17,715 1,098,352
24.6%
0.5%
16.1%
0.7%
Volume (USD mm)
ADV
3,222
2,838
1,197
788
410
6,060 375,713 22.5% 15,155 939,624 27.5%
ADV
Total
11,025
175,975
199,738 12.0%
48,839
Volume (USD mm)
25,393
74,232 10.9%
FOOTNOTES
Numbers include all activity on Tradeweb, Dealerweb and Tradeweb Direct.
Corporate bond volume and trade count numbers reflect all trades reported to TRACE, excluding emerging market
and convertible bonds.
26,919 1,668,963
683,579
Monthly average capped volumes for HG and HY applied to capped trades based on TRACE reporting standards.
Electronically Processed include voice trades processed electronically on Tradeweb.
Day counts for corporate bonds reflect all SIFMA trading days.
Q1 2022
% of
TRACE
Total
10.5%
7.1%
3.7%
ADT
Q1 2022
Trades
Total
14,735 913,574 26.7%
420 26,050
141
ADT
3,324 206,090 19.1%
3,183
197,349
8,741
% of
TRACE
Trades
Total
55,113 3,417,019
17,419 1,079,983
0.8%
18.3%
0.8%
Volume (USD mm)
ADV
5,184
2,231
2,953 188,980
851
492
359
Total
331,750
ADV
142,770
54,435
31,460
22,975
Volume (USD mm)
Total
24,334 1,557,374
10,160
650,221
Q2 2021
% of
TRACE
21.3%
12.1%
9.2%
8.4%
4.8%
3.5%
ADT
Q2 2021
328
12,187 779,965 26.5%
11,859 758,975 25.8%
2,630
2.507
123
ADT
Trades
Total
15,615
20,990
168,328 16.8%
160,465 16.1%
Trades
% of
TRACE
7,863 0.8%
Total
46,032 2,946,070
0.7%
999,374
Tradeweb
QOQ
Volume (USD mm)
ADV
6.81%
% of
TRACE
0.54% 0.90% 17.54% 6.63%
7.19%
-15.27% -12.53%
-13.72% -10.93%
ADV
QoQ
-3.13%
-6.58% -6.25% 18.86% 7.83%
-14.74% -11.98% 20.02% 14.17%
ADT
-0.35% 29.48%
YoY
Volume (USD mm)
ADV
1.70%
-If the bond is not rated by any agency then the bond is HY.
- If 3 of 3 of the bond's ratings are better than BB+/Ba1/BB+ (but not including "other ratings") then the bond is HG.
- If 2 of 3 of the bond's ratings are better than BB+/Ba1/BB+ then the bond is HG.
16.54% 5.72%
% of
TRACE
35.78% 29.16%
-1.56% -6.36%
YOY
ADV ADT
10.23% 55.02%
Segmentation between HG and HY determined using the following methodology and ratings from Standards & Poor's (S&P),
Moody's Investor Services and Fitch Ratings:
- If 2 of 3 of the bond's ratings are equal to or worse than BB+/Ba1/BB+ (but not including "other ratings") then the bond is HY.
- If 1 of 3 of the bond's ratings is equal to or worse than BB+/Ba1/BB+, and none are better, then the bond is HY.
5.12% 13.45%
- If 1 of 3 of the bond's ratings is better than BB+/Ba1/BB+, and none are equal or worse, then the bond is HG.
- If 1 of 3 of the bond's ratings is better than BB+/Ba1/BB+ and 1 of 3 is equal or worse, then the bond is HG. (i.e. The bond is
split rated: 1 HG, 1 HY).View entire presentation