3Q24 Investor Update
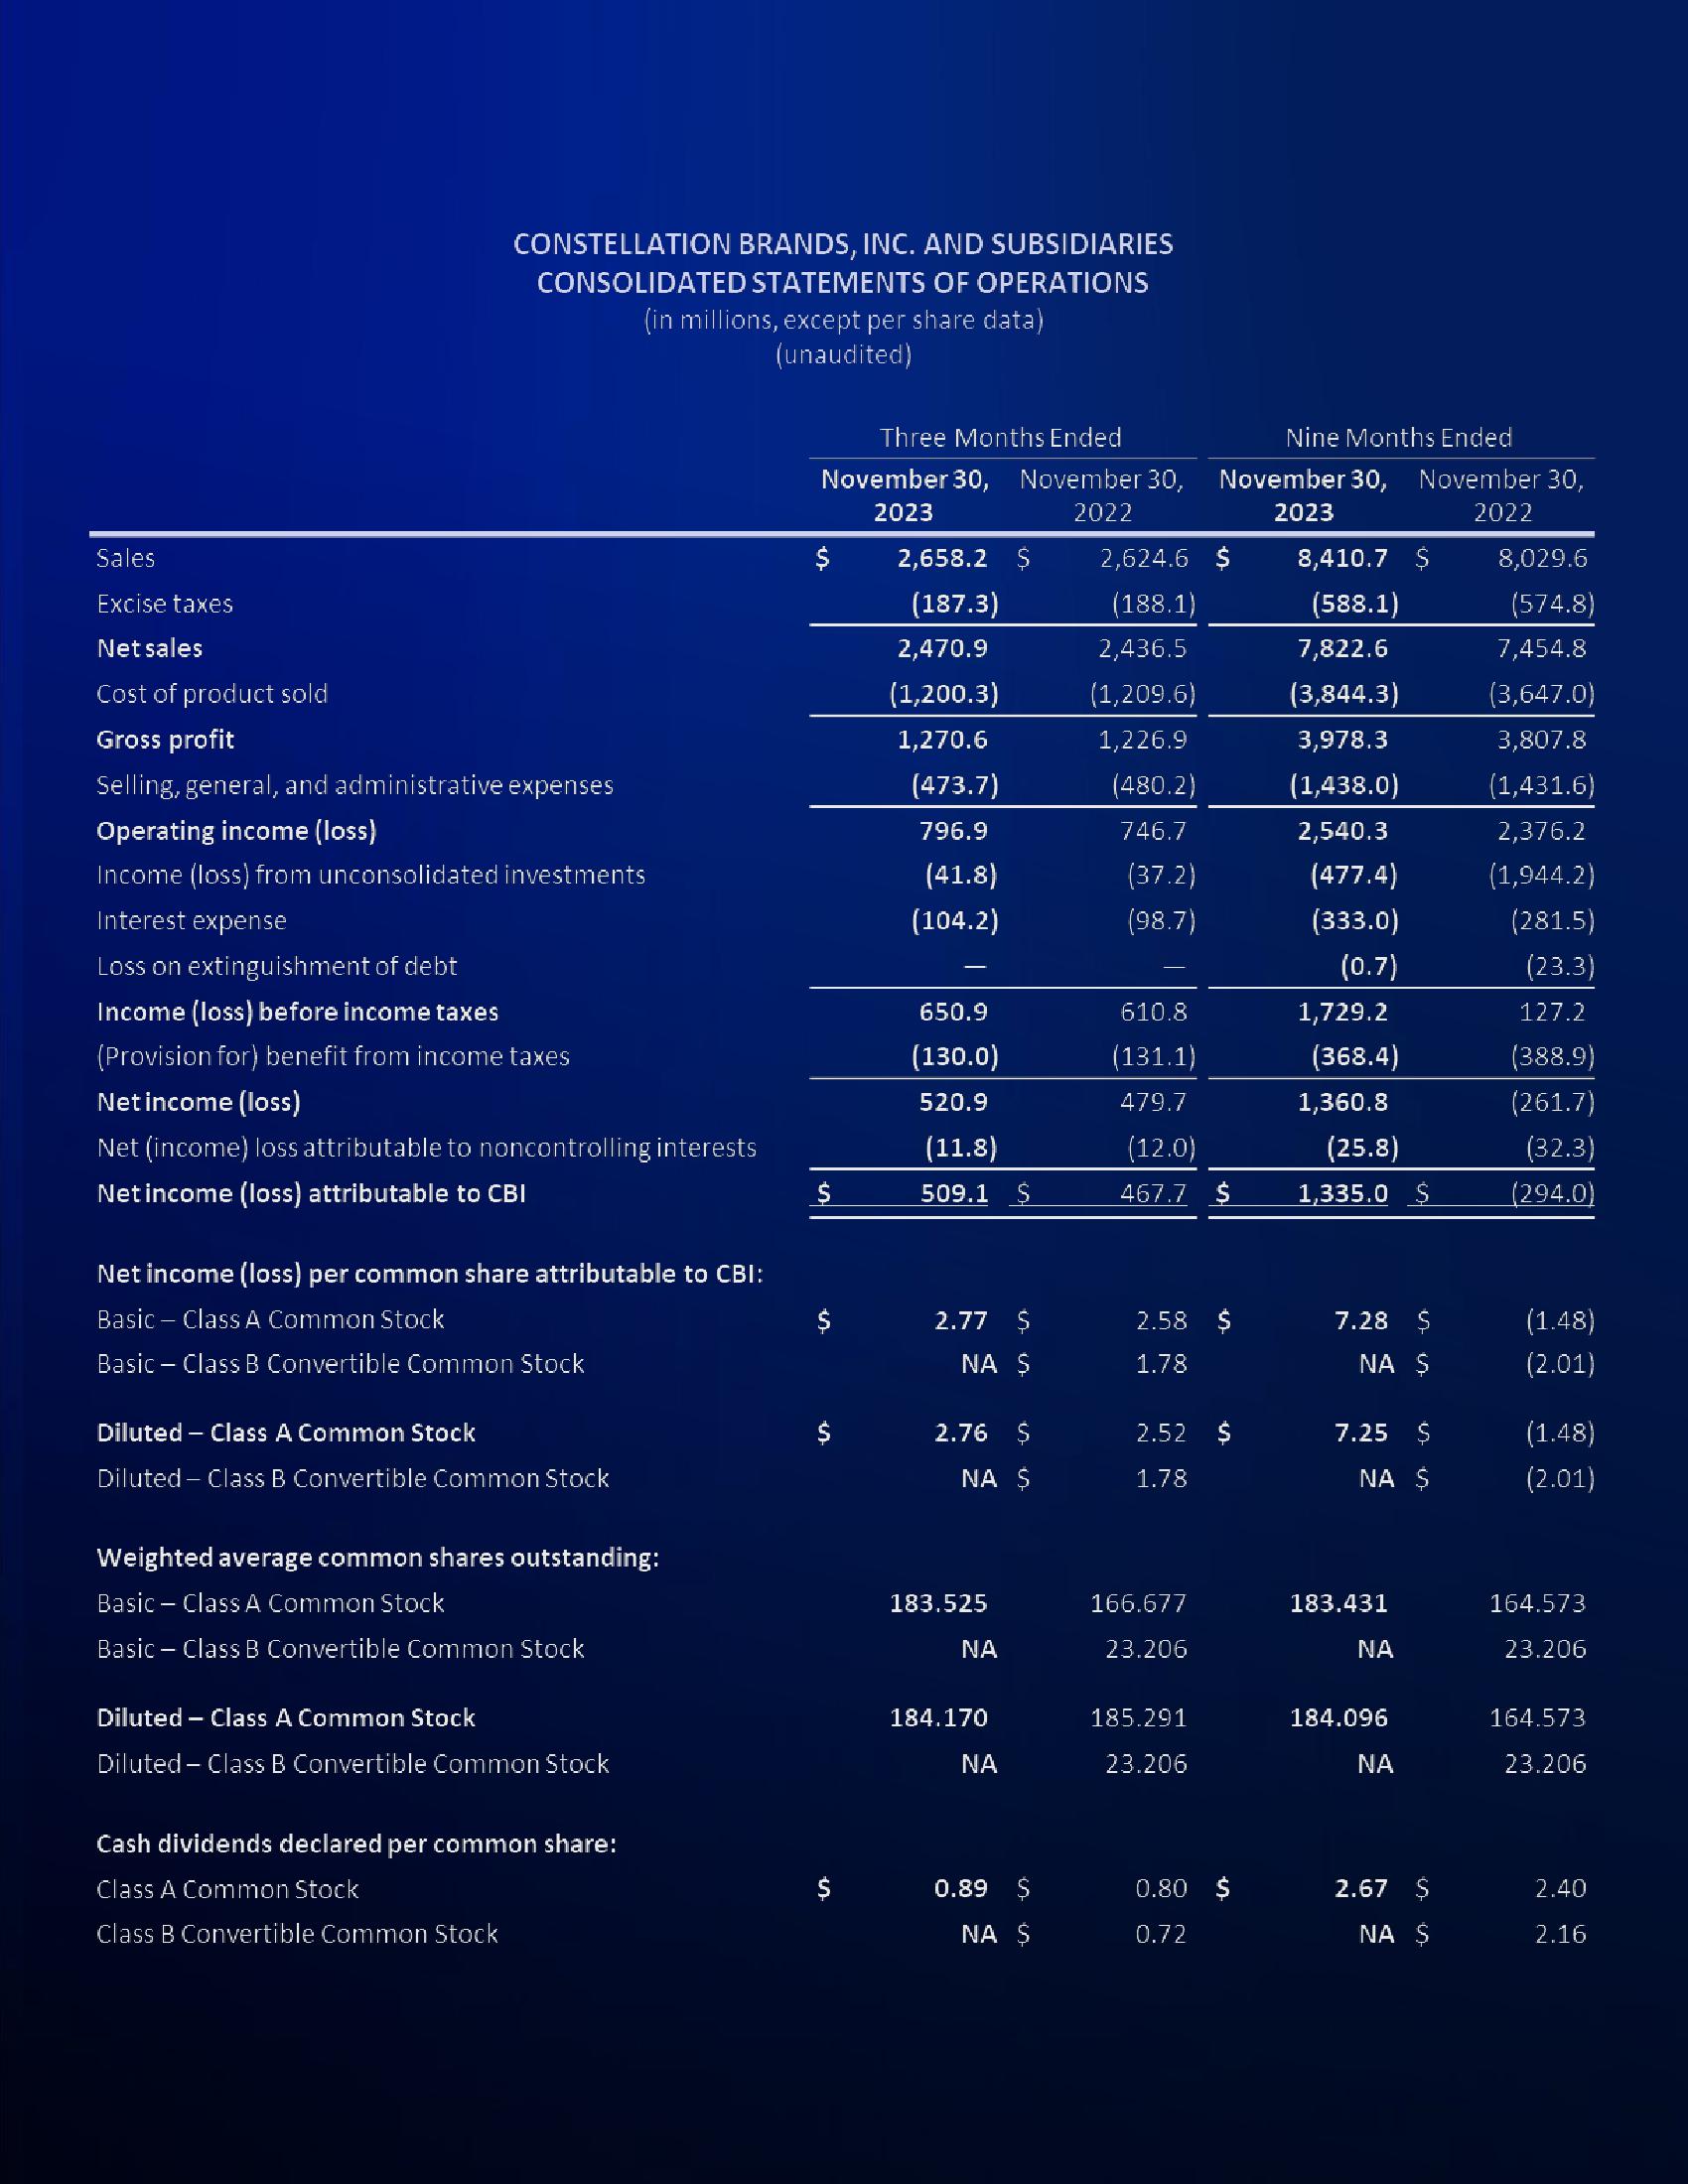
CONSTELLATION BRANDS, INC. AND SUBSIDIARIES
CONSOLIDATED STATEMENTS OF OPERATIONS
(in millions, except per share data)
(unaudited)
Sales
Excise taxes
Net sales
Cost of product sold
Gross profit
Selling, general, and administrative expenses
Operating income (loss)
Income (loss) from unconsolidated investments
Interest expense
Loss on extinguishment of debt
Income (loss) before income taxes
(Provision for) benefit from income taxes
Net income (loss)
Net (income) loss attributable to noncontrolling interests
Net income (loss) attributable to CBI
Net income (loss) per common share attributable to CBI:
Basic Class A Common Stock
Basic - Class B Convertible Common Stock
Diluted - Class A Common Stock
Diluted - Class B Convertible Common Stock
Weighted average common shares outstanding:
Basic - Class A Common Stock
Basic - Class B Convertible Common Stock
Diluted - Class A Common Stock
Diluted - Class B Convertible Common Stock
Cash dividends declared per common share:
Class A Common Stock
Class B Convertible Common Stock
Three Months Ended
November 30, November 30,
2023
2022
$
2,658.2 $
(187.3)
2,470.9
(1,200.3)
1,270.6
(473.7)
796.9
(41.8)
(104.2)
650.9
(130.0)
520.9
(11.8)
509.1 S
2.77 $
NA S
2.76 $
NA S
183.525
ΝΑ
184.170
ΝΑ
0.89 $
NA S
2,624.6 $
(188.1)
2,436.5
(1,209.6)
1,226.9
(480.2)
746.7
(37.2)
(98.7)
610.8
(131.1)
479.7
(12.0)
467.7 $
Nine Months Ended
November 30, November 30,
2023
2022
2.58 $
1.78
2.52
1.78
166.677
23.206
185.291
23.206
s
0.80 $
0.72
8,410.7 $
(588.1)
7,822.6
(3,844.3)
3,978.3
(1,438.0)
2,540.3
(477.4)
(333.0)
(0.7)
1,729.2
(368.4)
1,360.8
(25.8)
1,335.0 $
7.28 $
NA S
7.25 $
NA $
183.431
ΝΑ
184.096
ΝΑ
2.67 $
NA S
8,029.6
(574.8)
7,454.8
(3,647.0)
3,807.8
(1,431.6)
2,376.2
(1,944.2)
(281.5)
(23.3)
127.2
(388.9)
(261.7)
(32.3)
(294.0)
(1.48)
(2.01)
(1.48)
(2.01)
164.573
23.206
164.573
23.206
2.40
2.16View entire presentation