CorpAcq SPAC Presentation Deck
$mm
Compelling Cash Profile Should Provide a
3D Strong Capital Returns Story from Inception
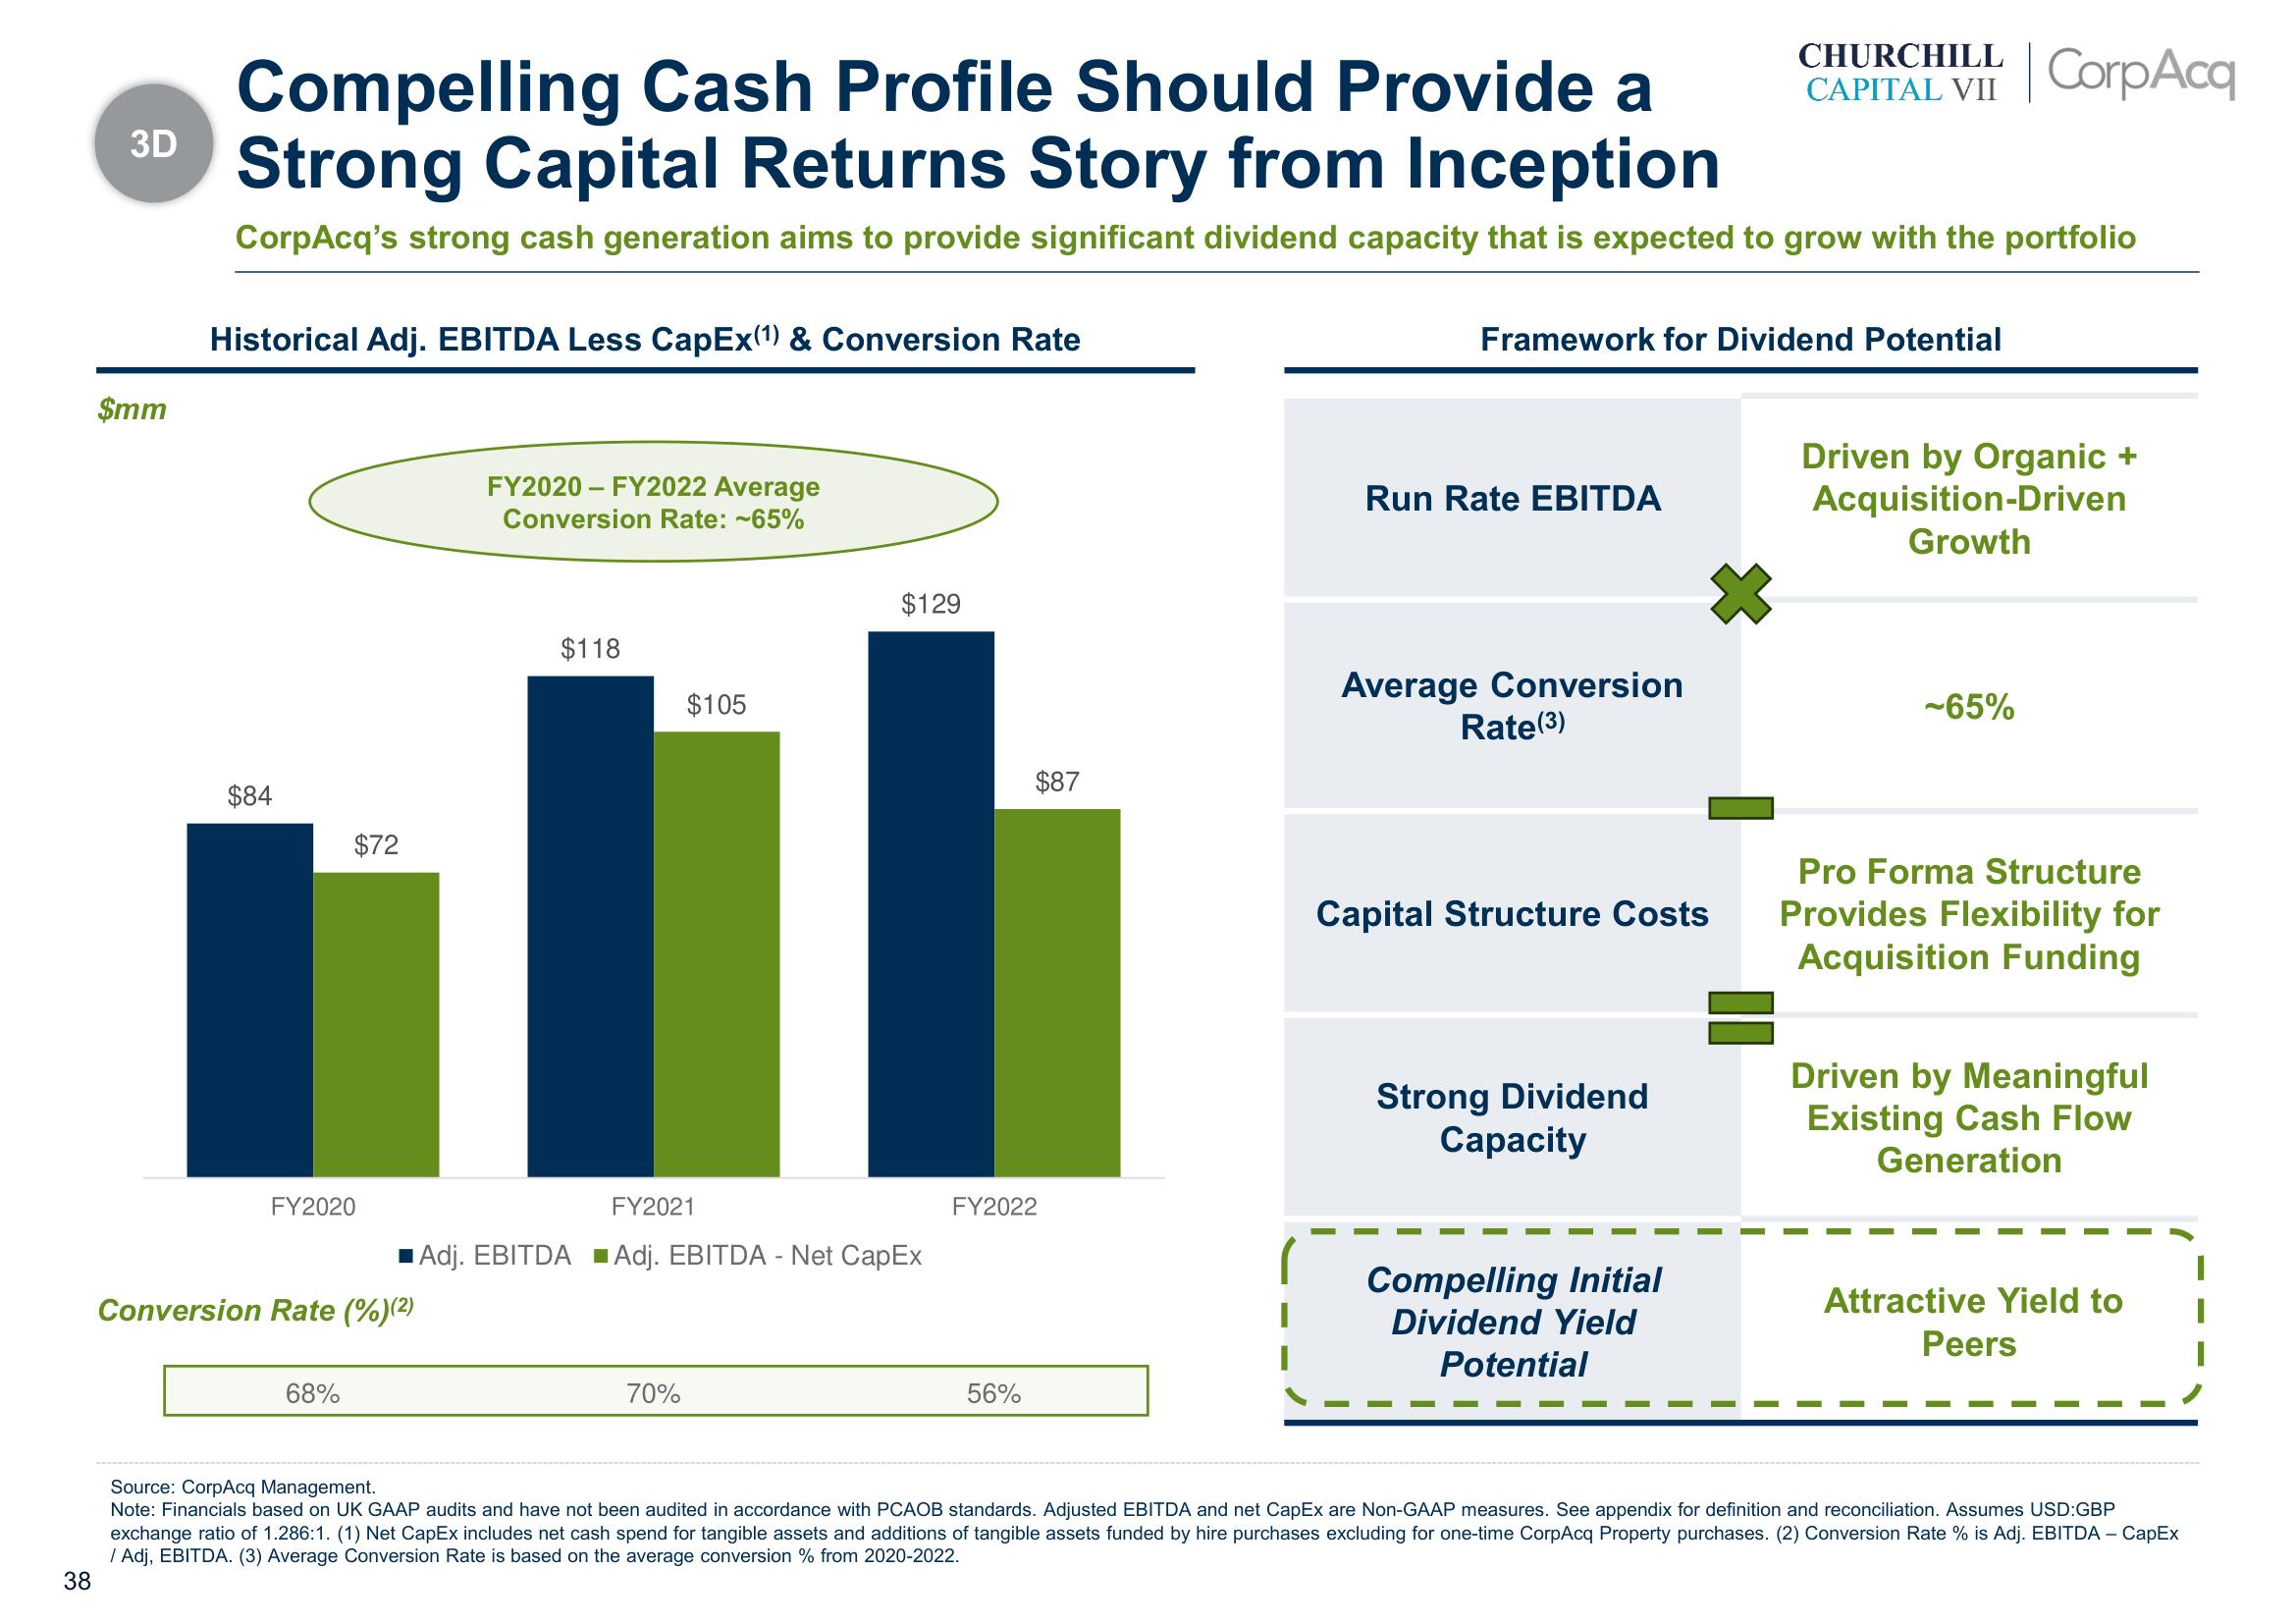
CorpAcq's strong cash generation aims to provide significant dividend capacity that is expected to grow with the portfolio
Historical Adj. EBITDA Less CapEx(1) & Conversion Rate
$84
$72
FY2020
68%
Conversion Rate (%)(2)
FY2020-FY2022 Average
Conversion Rate: -65%
$118
$105
FY2021
■Adj. EBITDA Adj. EBITDA - Net CapEx
70%
$129
$87
FY2022
56%
Framework for Dividend Potential
Run Rate EBITDA
Average Conversion
Rate(3)
Capital Structure Costs
CHURCHILL
CAPITAL VII
Strong Dividend
Capacity
Compelling Initial
Dividend Yield
Potential
CorpAcq
Driven by Organic +
Acquisition-Driven
Growth
-65%
Pro Forma Structure
Provides Flexibility for
Acquisition Funding
Driven by Meaningful
Existing Cash Flow
Generation
Attractive Yield to
Peers
Source: CorpAcq Management.
Note: Financials based on UK GAAP audits and have not been audited in accordance with PCAOB standards. Adjusted EBITDA and net CapEx are Non-GAAP measures. See appendix for definition and reconciliation. Assumes USD:GBP
exchange ratio of 1.286:1. (1) Net CapEx includes net cash spend for tangible assets and additions of tangible assets funded by hire purchases excluding for one-time CorpAcq Property purchases. (2) Conversion Rate % is Adj. EBITDA - CapEx
/ Adj, EBITDA. (3) Average Conversion Rate is based on the average conversion % from 2020-2022.
38View entire presentation