Telia Company Results Presentation Deck
SWEDEN FINANCIALS
LO
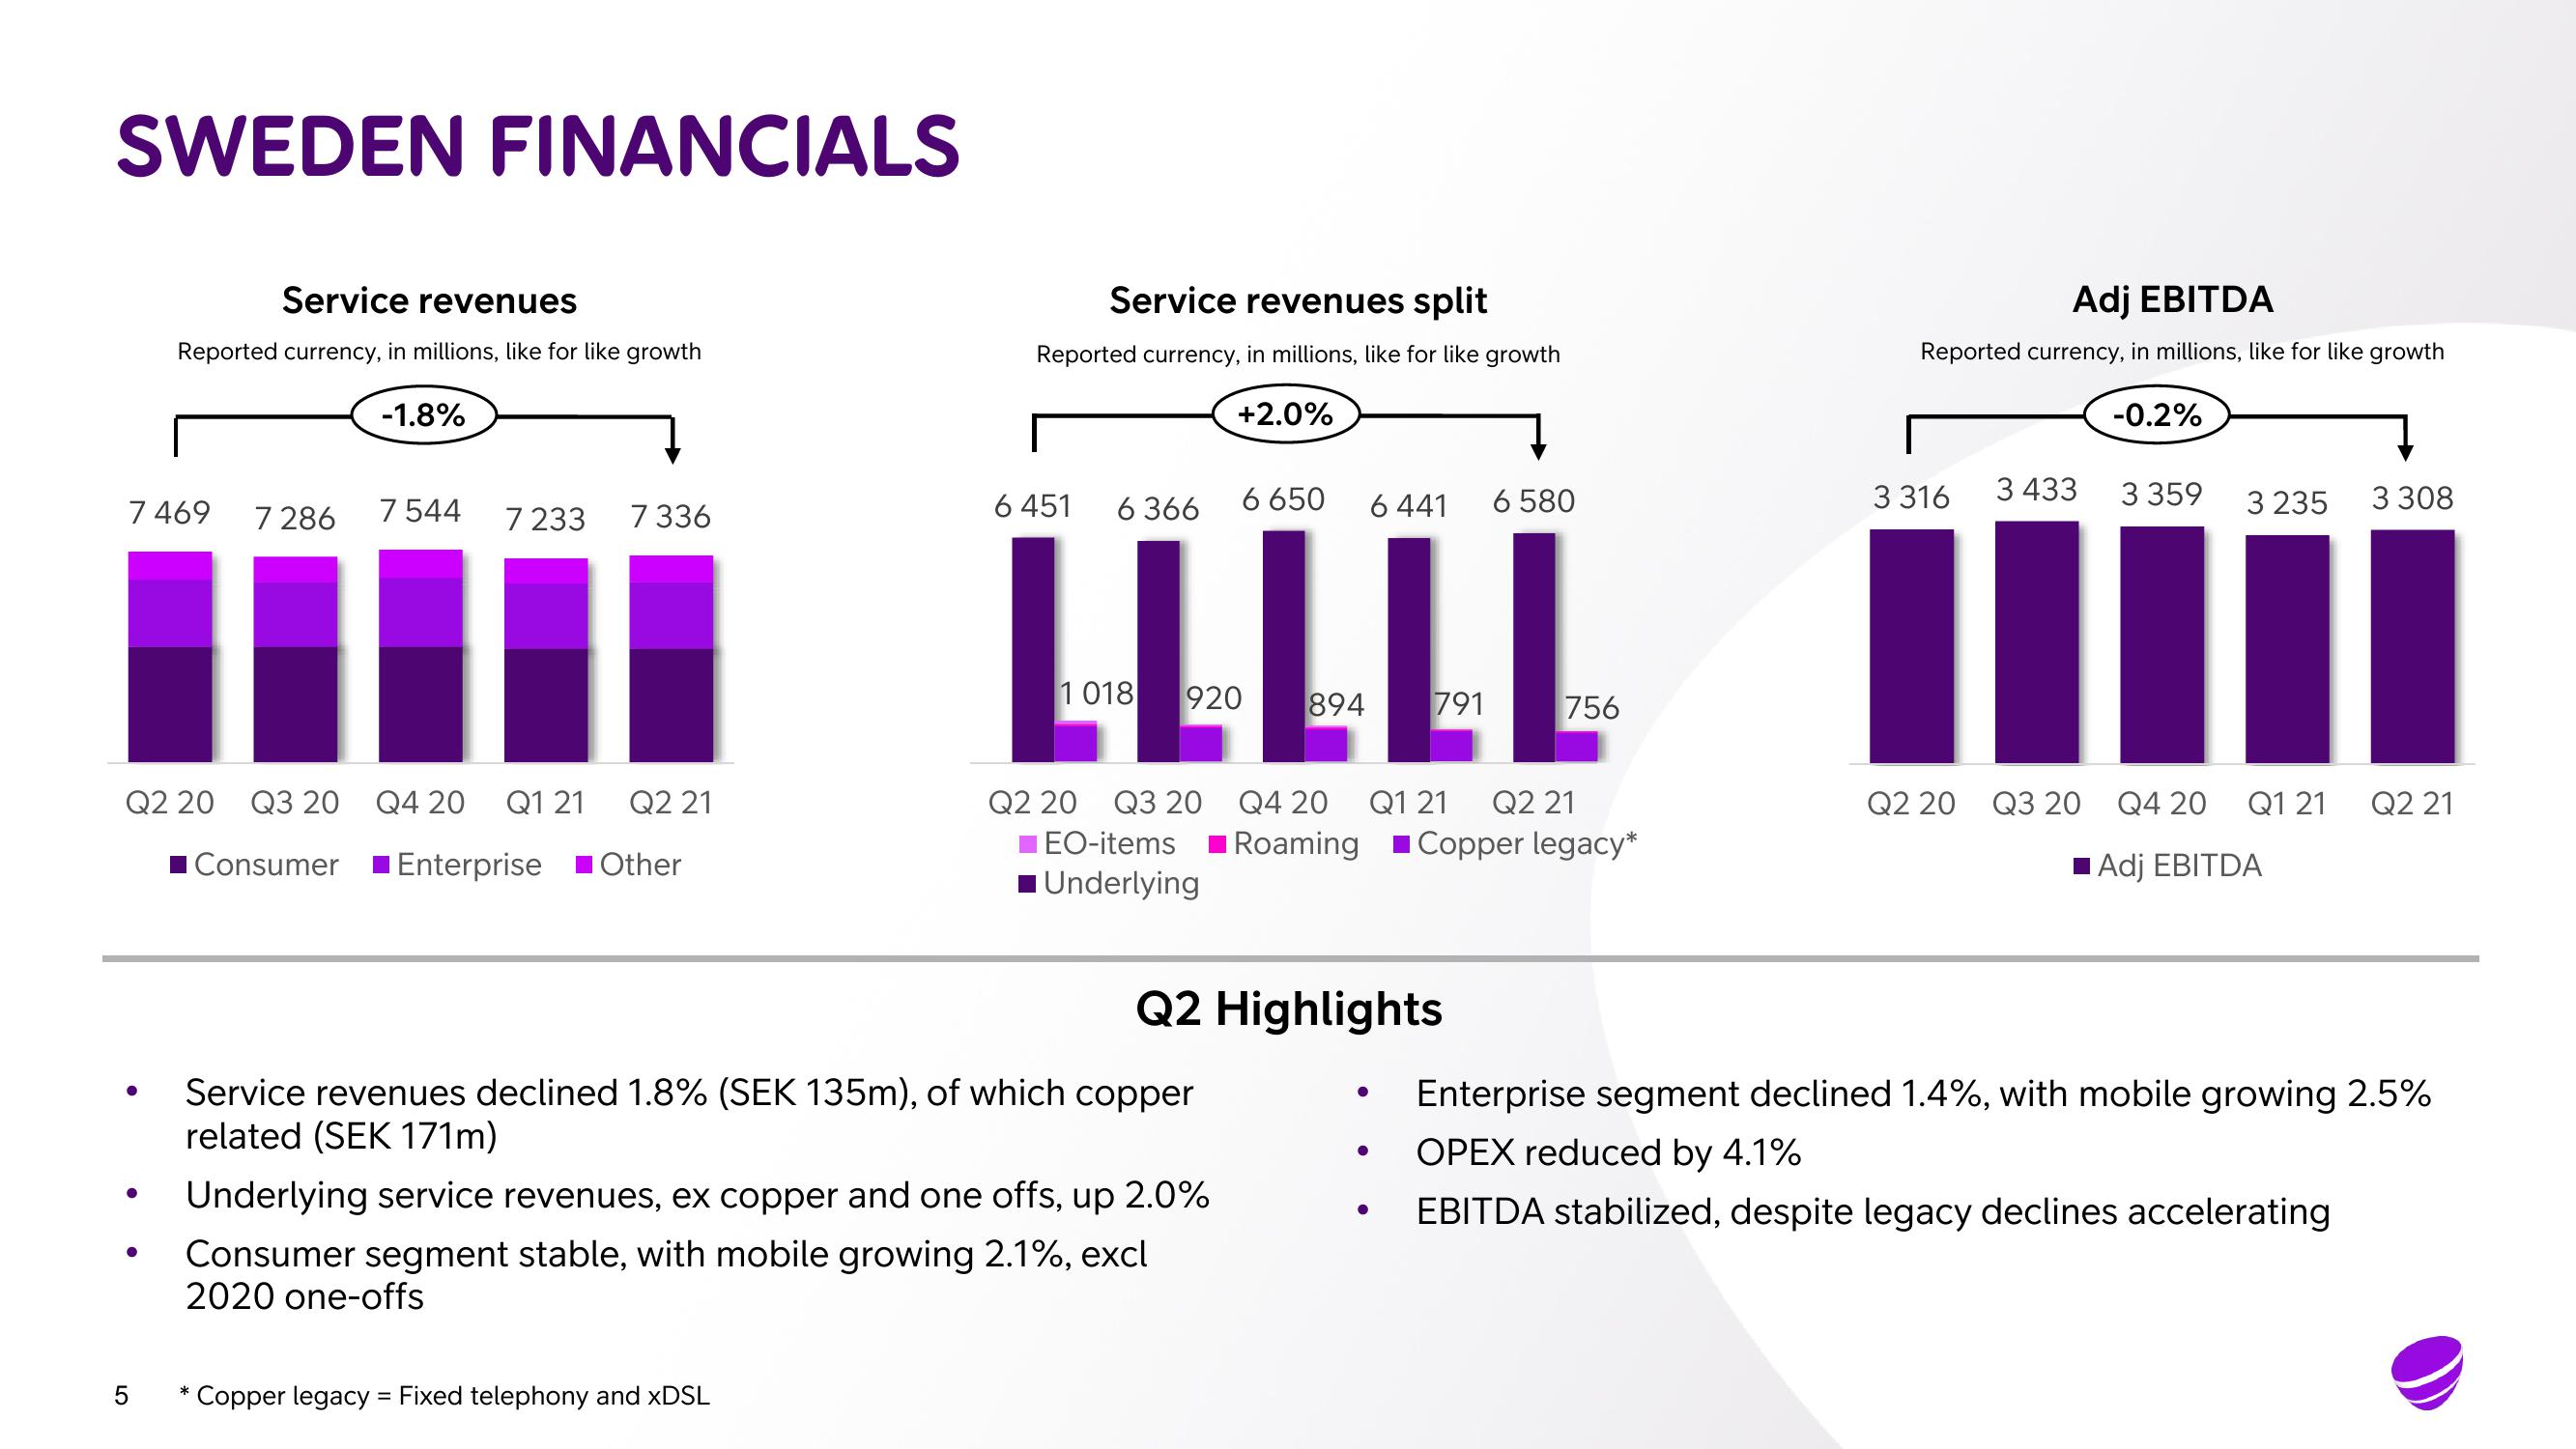
Service revenues
Reported currency, in millions, like for like growth
-1.8%
7 469
5
7 286
7544
Q2 20 Q3 20
Q2 21
■Consumer Enterprise Other
*
7 233
Q4 20
7 336
Q1 21
Service revenues split
Reported currency, in millions, like for like growth
+2.0%
6 650
LLLLL
1 018 920
Copper legacy = Fixed telephony and xDSL
6 451
6 366
Service revenues declined 1.8% (SEK 135m), of which copper
related (SEK 171m)
Underlying service revenues, ex copper and one offs, up 2.0%
Consumer segment stable, with mobile growing 2.1%, excl
2020 one-offs
6 441
Q2 Highlights
Q2 20 Q3 20 Q4 20 Q1 21 Q2 21
EO-items Roaming Copper legacy*
Underlying
●
●
6 580
●
756
Adj EBITDA
Reported currency, in millions, like for like growth
-0.2%
3 316
3 433
3 359
Q2 20 Q3 20 Q4 20
3 235
Q1 21
Adj EBITDA
3 308
Q2 21
Enterprise segment declined 1.4%, with mobile growing 2.5%
OPEX reduced by 4.1%
EBITDA stabilized, despite legacy declines acceleratingView entire presentation