Oatly Results Presentation Deck
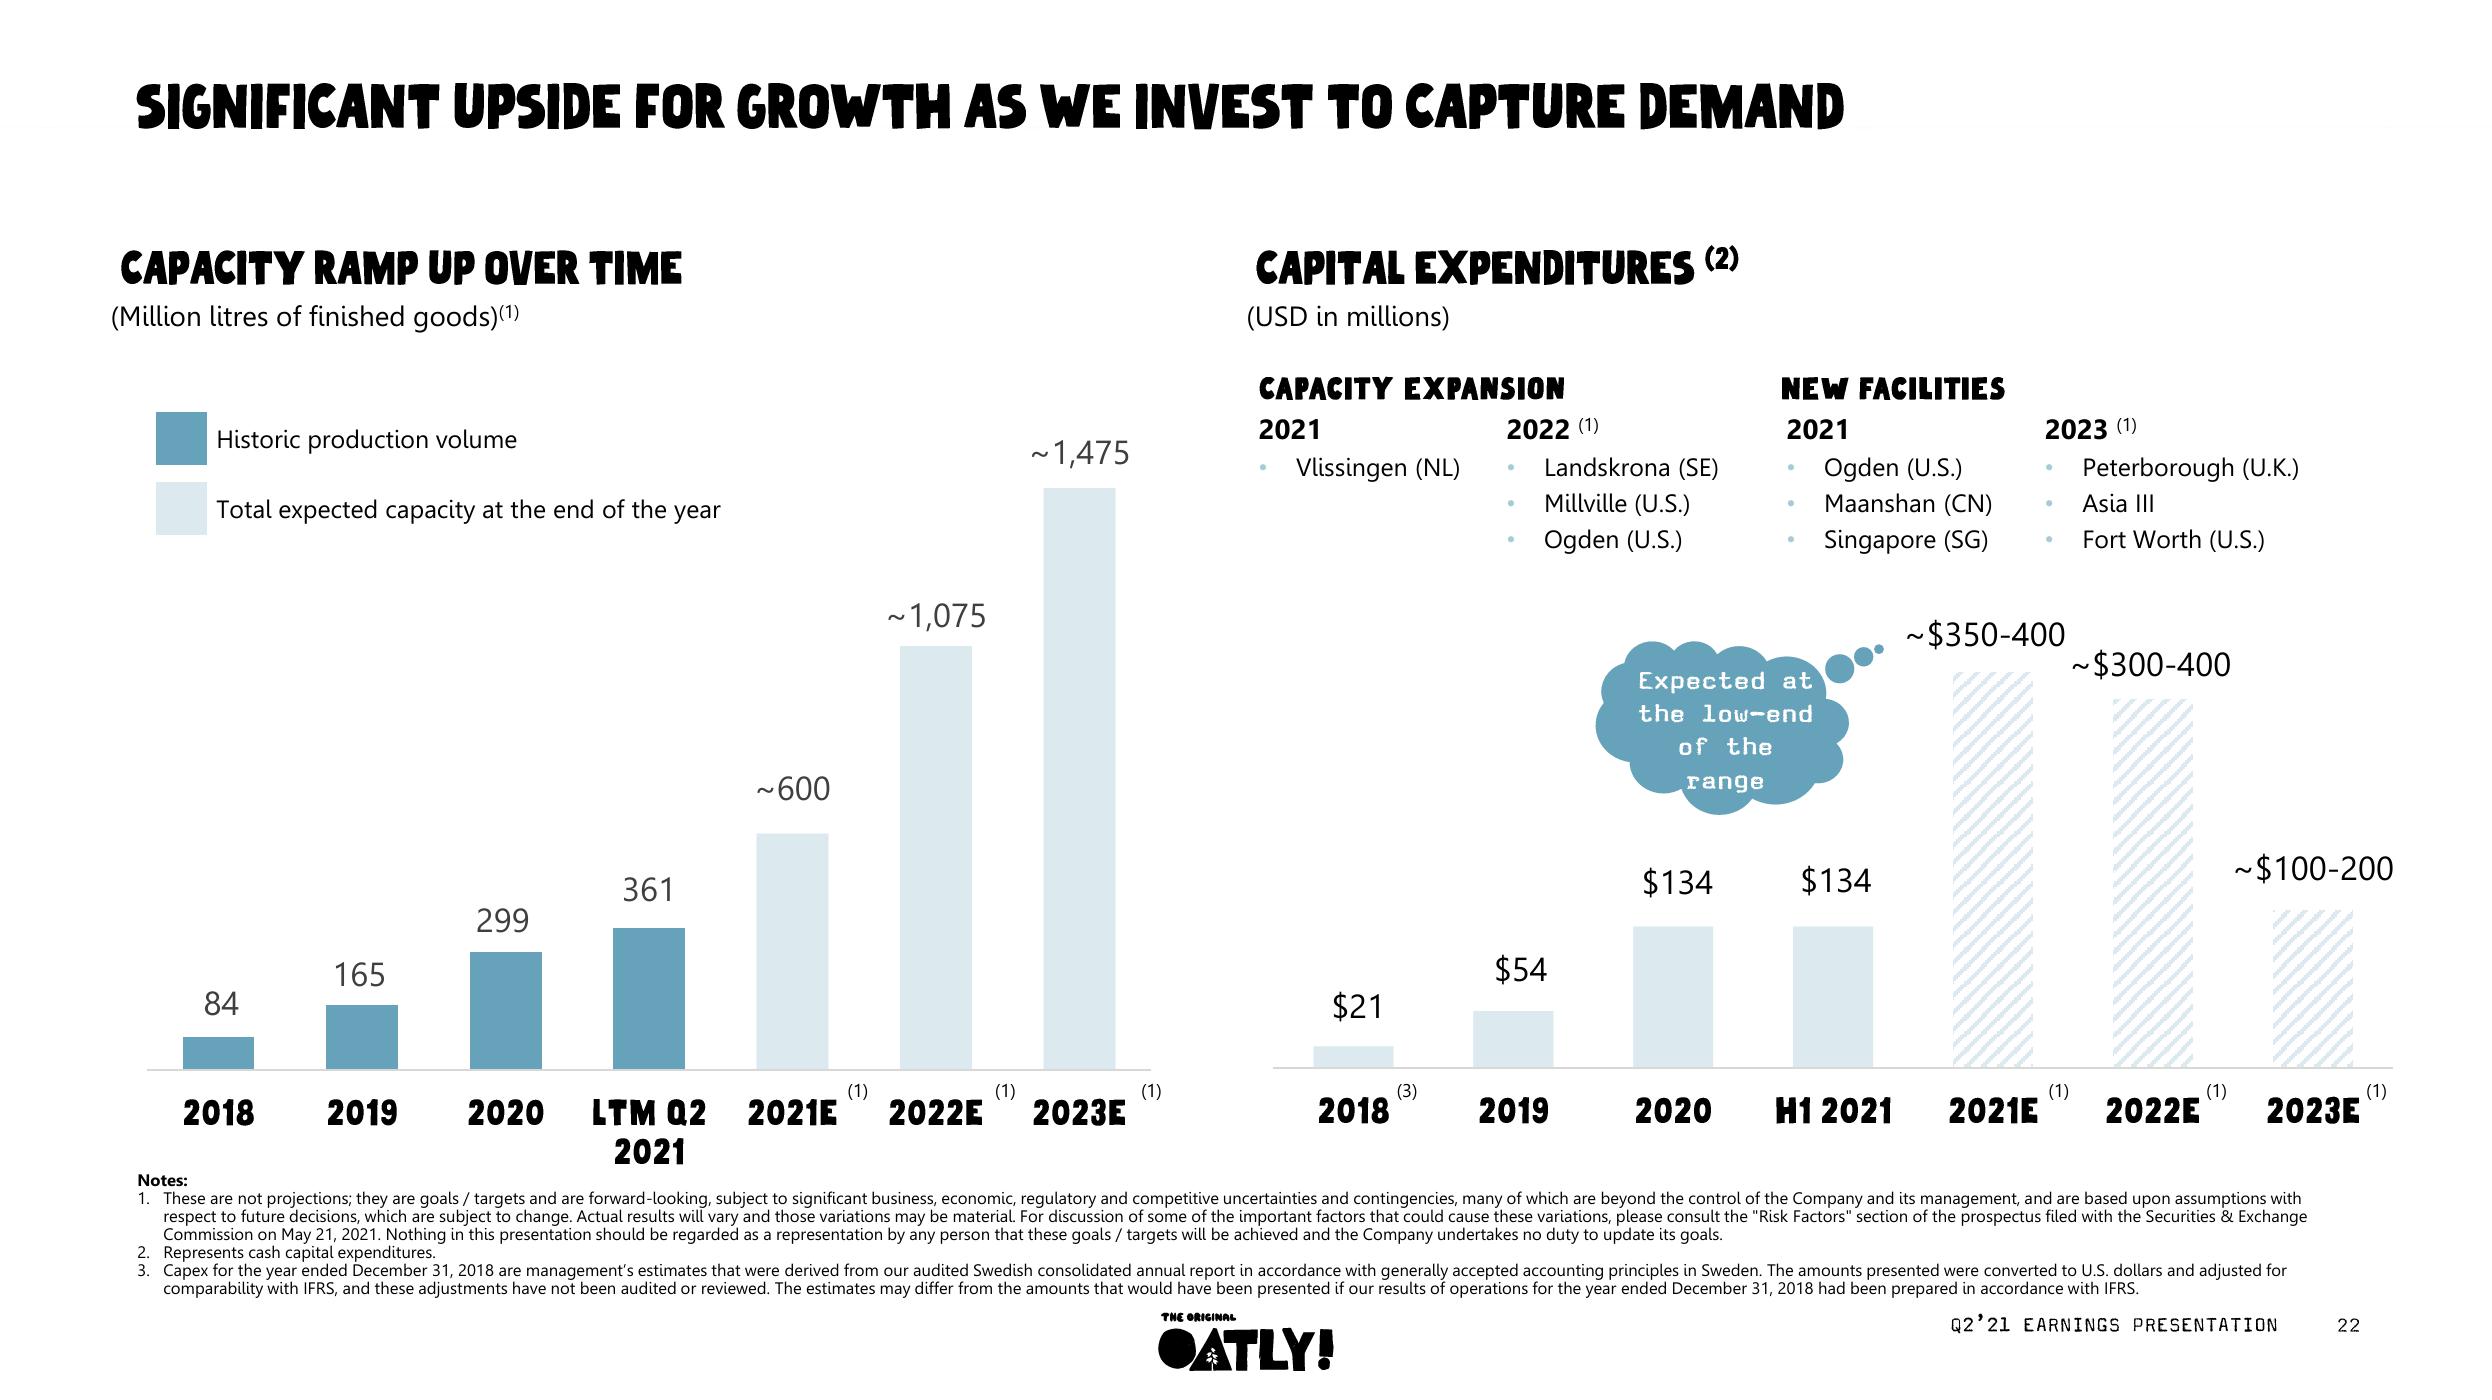
SIGNIFICANT UPSIDE FOR GROWTH AS WE INVEST TO CAPTURE DEMAND
CAPACITY RAMP UP OVER TIME
(Million litres of finished goods) (¹)
Historic production volume
Total expected capacity at the end of the year
84
2018
165
2019
299
2020
361
~600
(1)
~1,075
(1)
~1,475
LTM Q2 2021E 2022E 2023E
2021
(1)
CAPITAL EXPENDITURES (2)
(USD in millions)
CAPACITY EXPANSION
2021
THE ORIGINAL
Vlissingen (NL)
$21
2018
(3)
2022 (1)
OATLY!
.
·
Landskrona (SE)
Millville (U.S.)
Ogden (U.S.)
$54
2019
$134
NEW FACILITIES
2021
Expected at
the low-end
of the
range
2020
●
Ogden (U.S.)
Maanshan (CN)
Singapore (SG)
$134
H1 2021
2023 (1)
2021E
·
~$350-400
(1)
Peterborough (U.K.)
Asia III
Fort Worth (U.S.)
~$300-400
(1)
~$100-200
Notes:
1. These are not projections; they are goals / targets and are forward-looking, subject to significant business, economic, regulatory and competitive uncertainties and contingencies, many of which are beyond the control of the Company and its management, and are based upon assumptions with
respect to future decisions, which are subject to change. Actual results will vary and those variations may be material. For discussion of some of the important factors that could cause these variations, please consult the "Risk Factors" section of the prospectus filed with the Securities & Exchange
Commission on May 21, 2021. Nothing in this presentation should be regarded as a representation by any person that these goals / targets will be achieved and the Company undertakes no duty to update its goals.
2. Represents cash capital expenditures.
2022E 2023E
3. Capex for the year ended December 31, 2018 are management's estimates that were derived from our audited Swedish consolidated annual report in accordance with generally accepted accounting principles in Sweden. The amounts presented were converted to U.S. dollars and adjusted for
comparability with IFRS, and these adjustments have not been audited or reviewed. The estimates may differ from the amounts that would have been presented if our results of operations for the year ended December 31, 2018 had been prepared in accordance with IFRS.
Q2'21 EARNINGS PRESENTATION
22
(1)View entire presentation