Zegna Results Presentation Deck
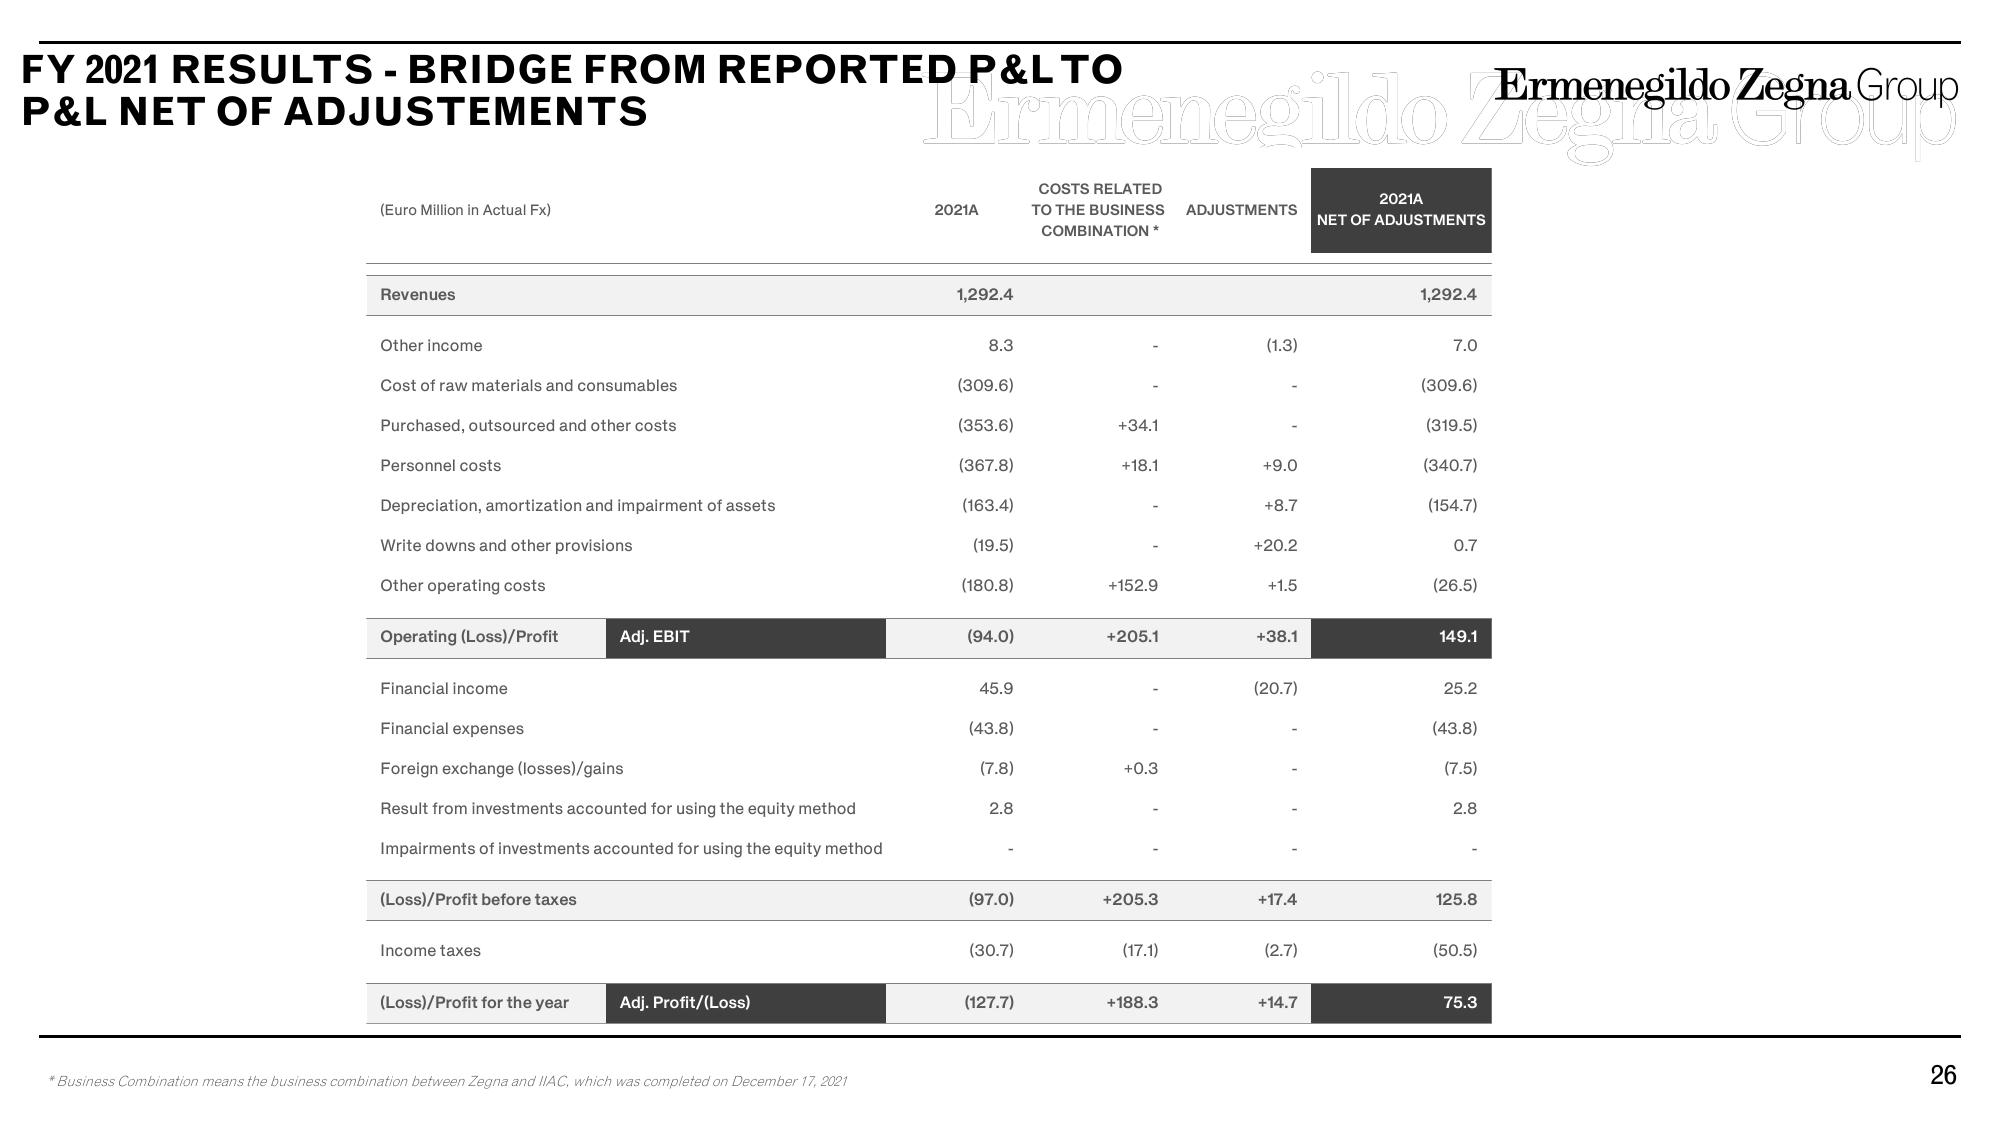
FY 2021 RESULTS - BRIDGE FROM REPORTED P&L TO
P&L NET OF ADJUSTEMENTS
(Euro Million in Actual Fx)
Revenues
Other income
Cost of raw materials and consumables
Purchased, outsourced and other costs
Personnel costs
Depreciation, amortization and impairment of assets
Write downs and other provisions
Other operating costs
Operating (Loss)/Profit
Financial income
Financial expenses
Foreign exchange (losses)/gains
Result from investments accounted for using the equity method
Impairments of investments accounted for using the equity method
(Loss)/Profit before taxes
Income taxes
Adj. EBIT
(Loss)/Profit for the year
Adj. Profit/(Loss)
* Business Combination means the business combination between Zegna and IIAC, which was completed on December 17, 2021
Wit menegildo ZErmenegildo Zegna Group
2021A
1,292.4
8.3
(309.6)
(353.6)
(367.8)
(163.4)
(19.5)
(180.8)
(94.0)
45.9
(43.8)
(7.8)
2.8
(97.0)
(30.7)
(127.7)
COSTS RELATED
TO THE BUSINESS
COMBINATION*
+34.1
+18.1
+152.9
+205.1
+0.3
+205.3
(17.1)
+188.3
ADJUSTMENTS
(1.3)
+9.0
+8.7
+20.2
+1.5
+38.1
(20.7)
+17.4
(2.7)
+14.7
2021A
NET OF ADJUSTMENTS
1,292.4
7.0
(309.6)
(319.5)
(340.7)
(154.7)
0.7
(26.5)
149.1
25.2
(43.8)
(7.5)
2.8
125.8
(50.5)
75.3
26View entire presentation