J.P.Morgan Results Presentation Deck
Asset & Wealth Management¹
Selected income statement data ($mm)
Revenue
Asset Management
Global Private Bank
Expense
Credit costs
Net income²
Key drivers / statistics ($B)³
Equity
ROE
Pretax margin
Assets under management ("AUM")
Client assets
Average loans
Average deposits
1 See note 1 on slide 14
2 See note 3 on slide 15
3 Actual numbers for all periods, not over/(under)
4Q22
$4,588
2,158
2,430
3,022
32
$1,134
4Q22
$17.0
26%
33
$2,766
4,048
214.2
237.0
$ 0/(U)
3Q22
$49
(51)
100
(6)
134
($85)
3Q22
$17.0
28%
36
$2,616
3,823
216.7
253.0
4Q21
$115
(330)
445
25
68
$9
4Q21
$14.0
31%
34
$3,113
4,295
209.2
264.6
8
CCB
CIB
CB
AWM Corp.
Financial performance
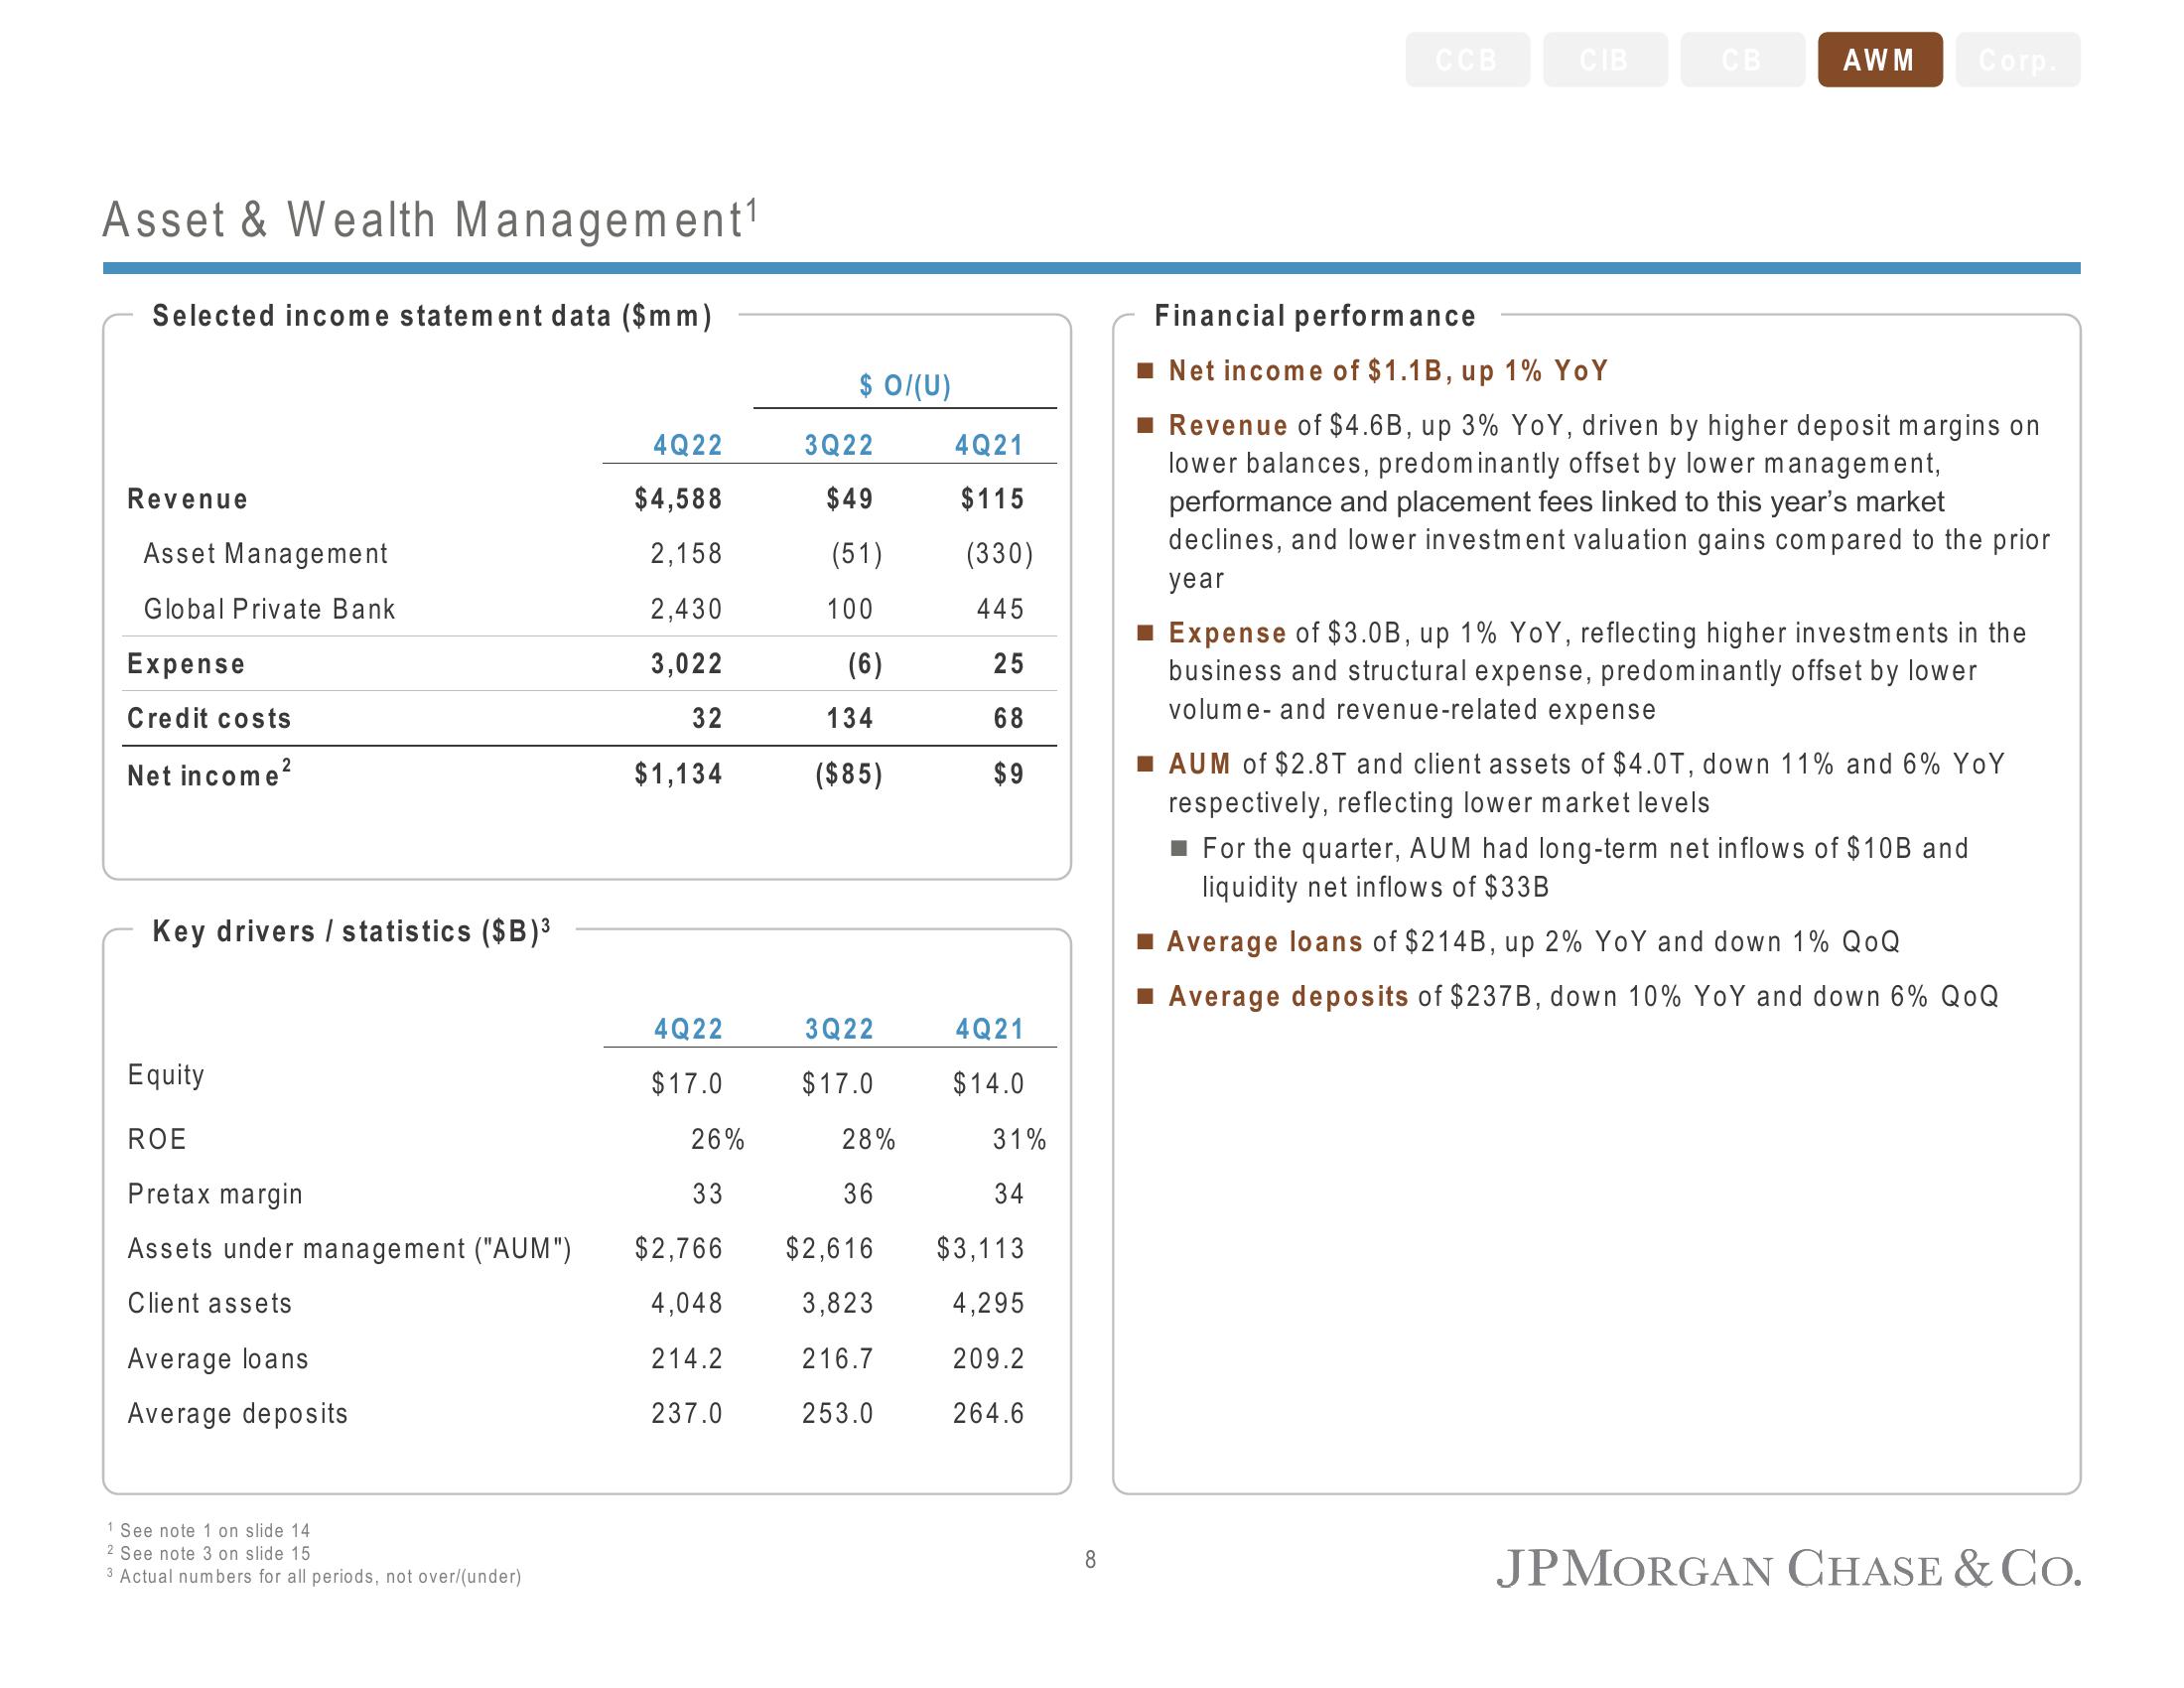
■ Net income of $1.1B, up 1% YoY
Revenue of $4.6B, up 3% YoY, driven by higher deposit margins on
lower balances, predominantly offset by lower management,
performance and placement fees linked to this year's market
declines, and lower investment valuation gains compared to the prior
year
■ Expense of $3.0B, up 1% YoY, reflecting higher investments in the
business and structural expense, predominantly offset by lower
volume- and revenue-related expense
■AUM of $2.8T and client assets of $4.0T, down 11% and 6% YoY
respectively, reflecting lower market levels
■ For the quarter, AUM had long-term net inflows of $10B and
liquidity net inflows of $33B
■ Average loans of $214B, up 2% YoY and down 1% QOQ
■ Average deposits of $237B, down 10% YoY and down 6% QOQ
JPMORGAN CHASE & Co.View entire presentation