HashiCorp Results Presentation Deck
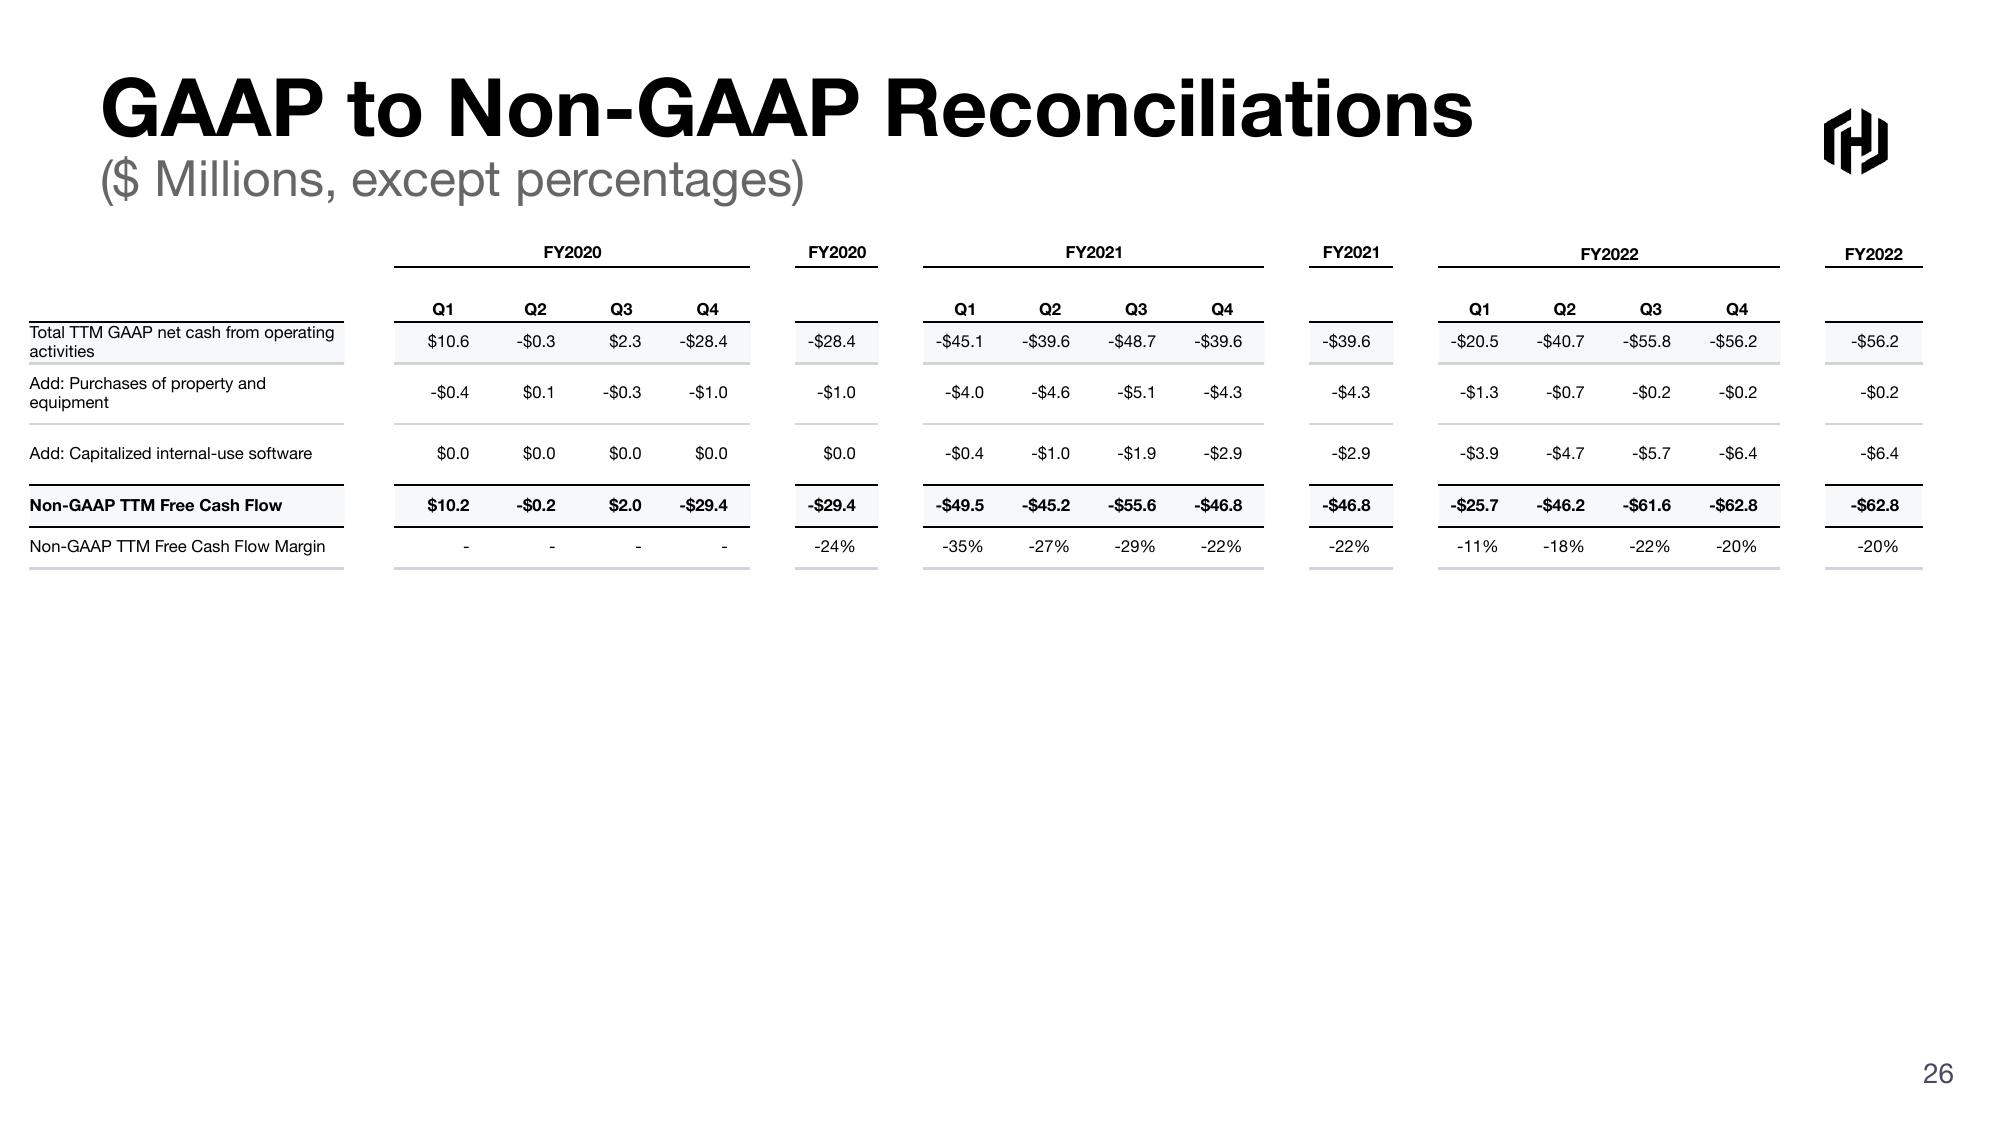
GAAP to Non-GAAP Reconciliations
($ Millions, except percentages)
Total TTM GAAP net cash from operating
activities.
Add: Purchases of property and
equipment
Add: Capitalized internal-use software
Non-GAAP TTM Free Cash Flow
Non-GAAP TTM Free Cash Flow Margin
Q1
$10.6
-$0.4
$0.0
$10.2
FY2020
Q2
-$0.3
$0.1
$0.0
-$0.2
Q3
$2.3
-$0.3
$0.0
$2.0
Q4
-$28.4
-$1.0
$0.0
-$29.4
FY2020
-$28.4
-$1.0
$0.0
-$29.4
-24%
Q1
-$45.1
-$4.0
-$0.4
-$49.5
-35%
FY2021
Q2
Q4
Q3
-$39.6 -$48.7 -$39.6
-$4.6
-$1.0
-$45.2
-27%
-$5.1
-$1.9
-$4.3
-29%
-$2.9
-$55.6 -$46.8
-22%
FY2021
-$39.6
-$4.3
-$2.9
-$46.8
-22%
Q1
-$20.5
-$1.3
-$3.9
-$25.7
-11%
FY2022
Q2
-$40.7
-$0.7
-$4.7
Q3
Q4
-$55.8 -$56.2
-18%
-$0.2
-$5.7
-$46.2 -$61.6
-22%
-$0.2
-$6.4
-$62.8
-20%
2
FY2022
-$56.2
-$0.2
-$6.4
-$62.8
-20%
26View entire presentation