Azerion Investor Presentation Deck
Financial update
Platform
82
Q2 '22
9.5
8
22.7
13.6
9.1
Q2 '22
100
13
Q2 '23
9.6
23.9
12.7
11.2
Q3 '22
azerion
—
revenue growth and benefits of consolidation and integration
Financial performance
189
155
il
17
10
10.7
Operational performance¹
32.8
16.1
16.7
H1'22
Q4 '22
12.2
30.0
18.8
11.2
H1'23
Q1 '23
13.0
36.3
20.8
15.6
Q2 '23
Net Revenue
■Adjusted EBITDA
Avg. digital Ads
Sold per Month (bn)
Total Avg. Gross
Revenue per
million processed
Ad Requests
Additional formats
Previous reported
figures
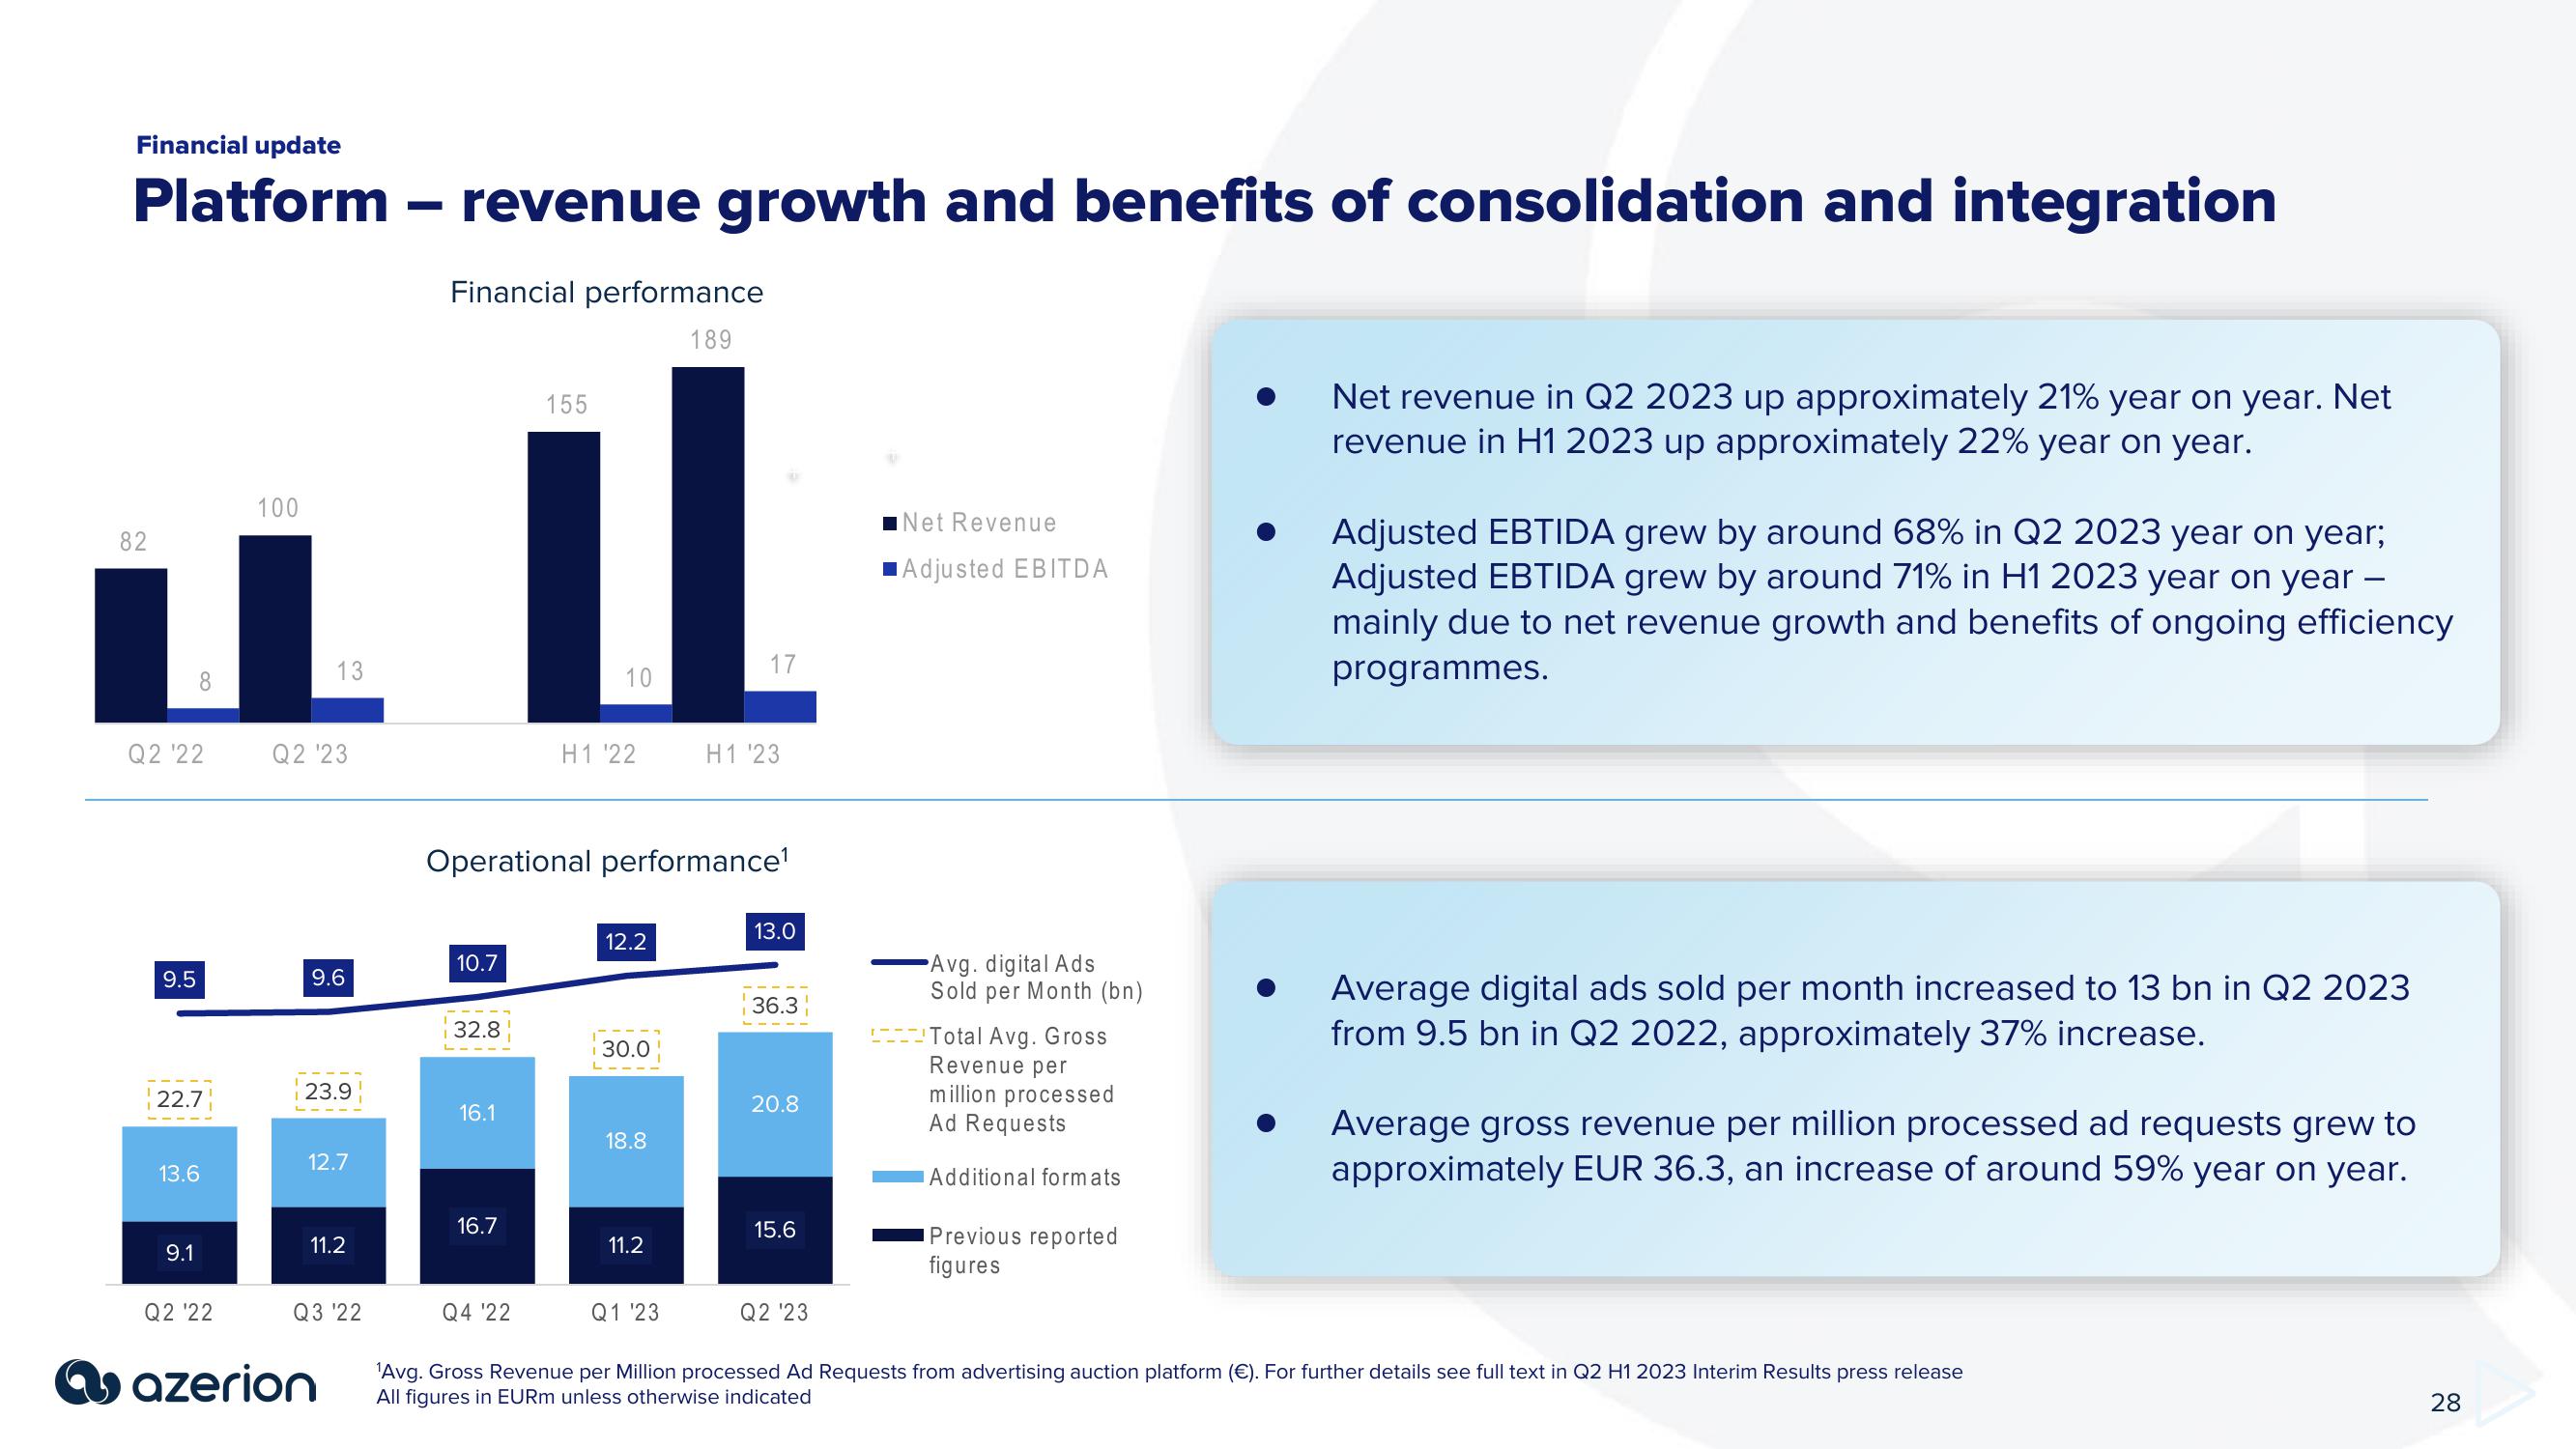
Net revenue in Q2 2023 up approximately 21% year on year. Net
revenue in H1 2023 up approximately 22% year on year.
Adjusted EBTIDA grew by around 68% in Q2 2023 year on year;
Adjusted EBTIDA grew by around 71% in H1 2023 year on year -
mainly due to net revenue growth and benefits of ongoing efficiency
programmes.
Average digital ads sold per month increased to 13 bn in Q2 2023
from 9.5 bn in Q2 2022, approximately 37% increase.
Average gross revenue per million processed ad requests grew to
approximately EUR 36.3, an increase of around 59% year on year.
¹Avg. Gross Revenue per Million processed Ad Requests from advertising auction platform (€). For further details see full text in Q2 H1 2023 Interim Results press release
All figures in EURm unless otherwise indicated
28View entire presentation