Evotec Results Presentation Deck
in € m¹)
evotec
Revenues
PAGE 11
Strong performance across all business lines
Segment information H1 2021- Evotec SE and subsidiaries
Gross margin
• R&D expenses
• SG&A expenses
Impairment of intangible
assets and goodwill
• Other op. income (expenses), net
Operating result
Adjusted EBITDA²)
Inter-
EVT
EVT
segment
Execute Innovate elimination
279.5
57.3
(65.5)
19.0%
(1.0)
(37.2)
11.4
26.2
51.9
16.3%
(40.5)
(9.2)
(0.7)
23.2
(17.9)
(15.7)
6.0
T
Evotec
Group
271.3
20.8%
(35.4)
(46.4)
(0.7)
34.5
8.3
36.2
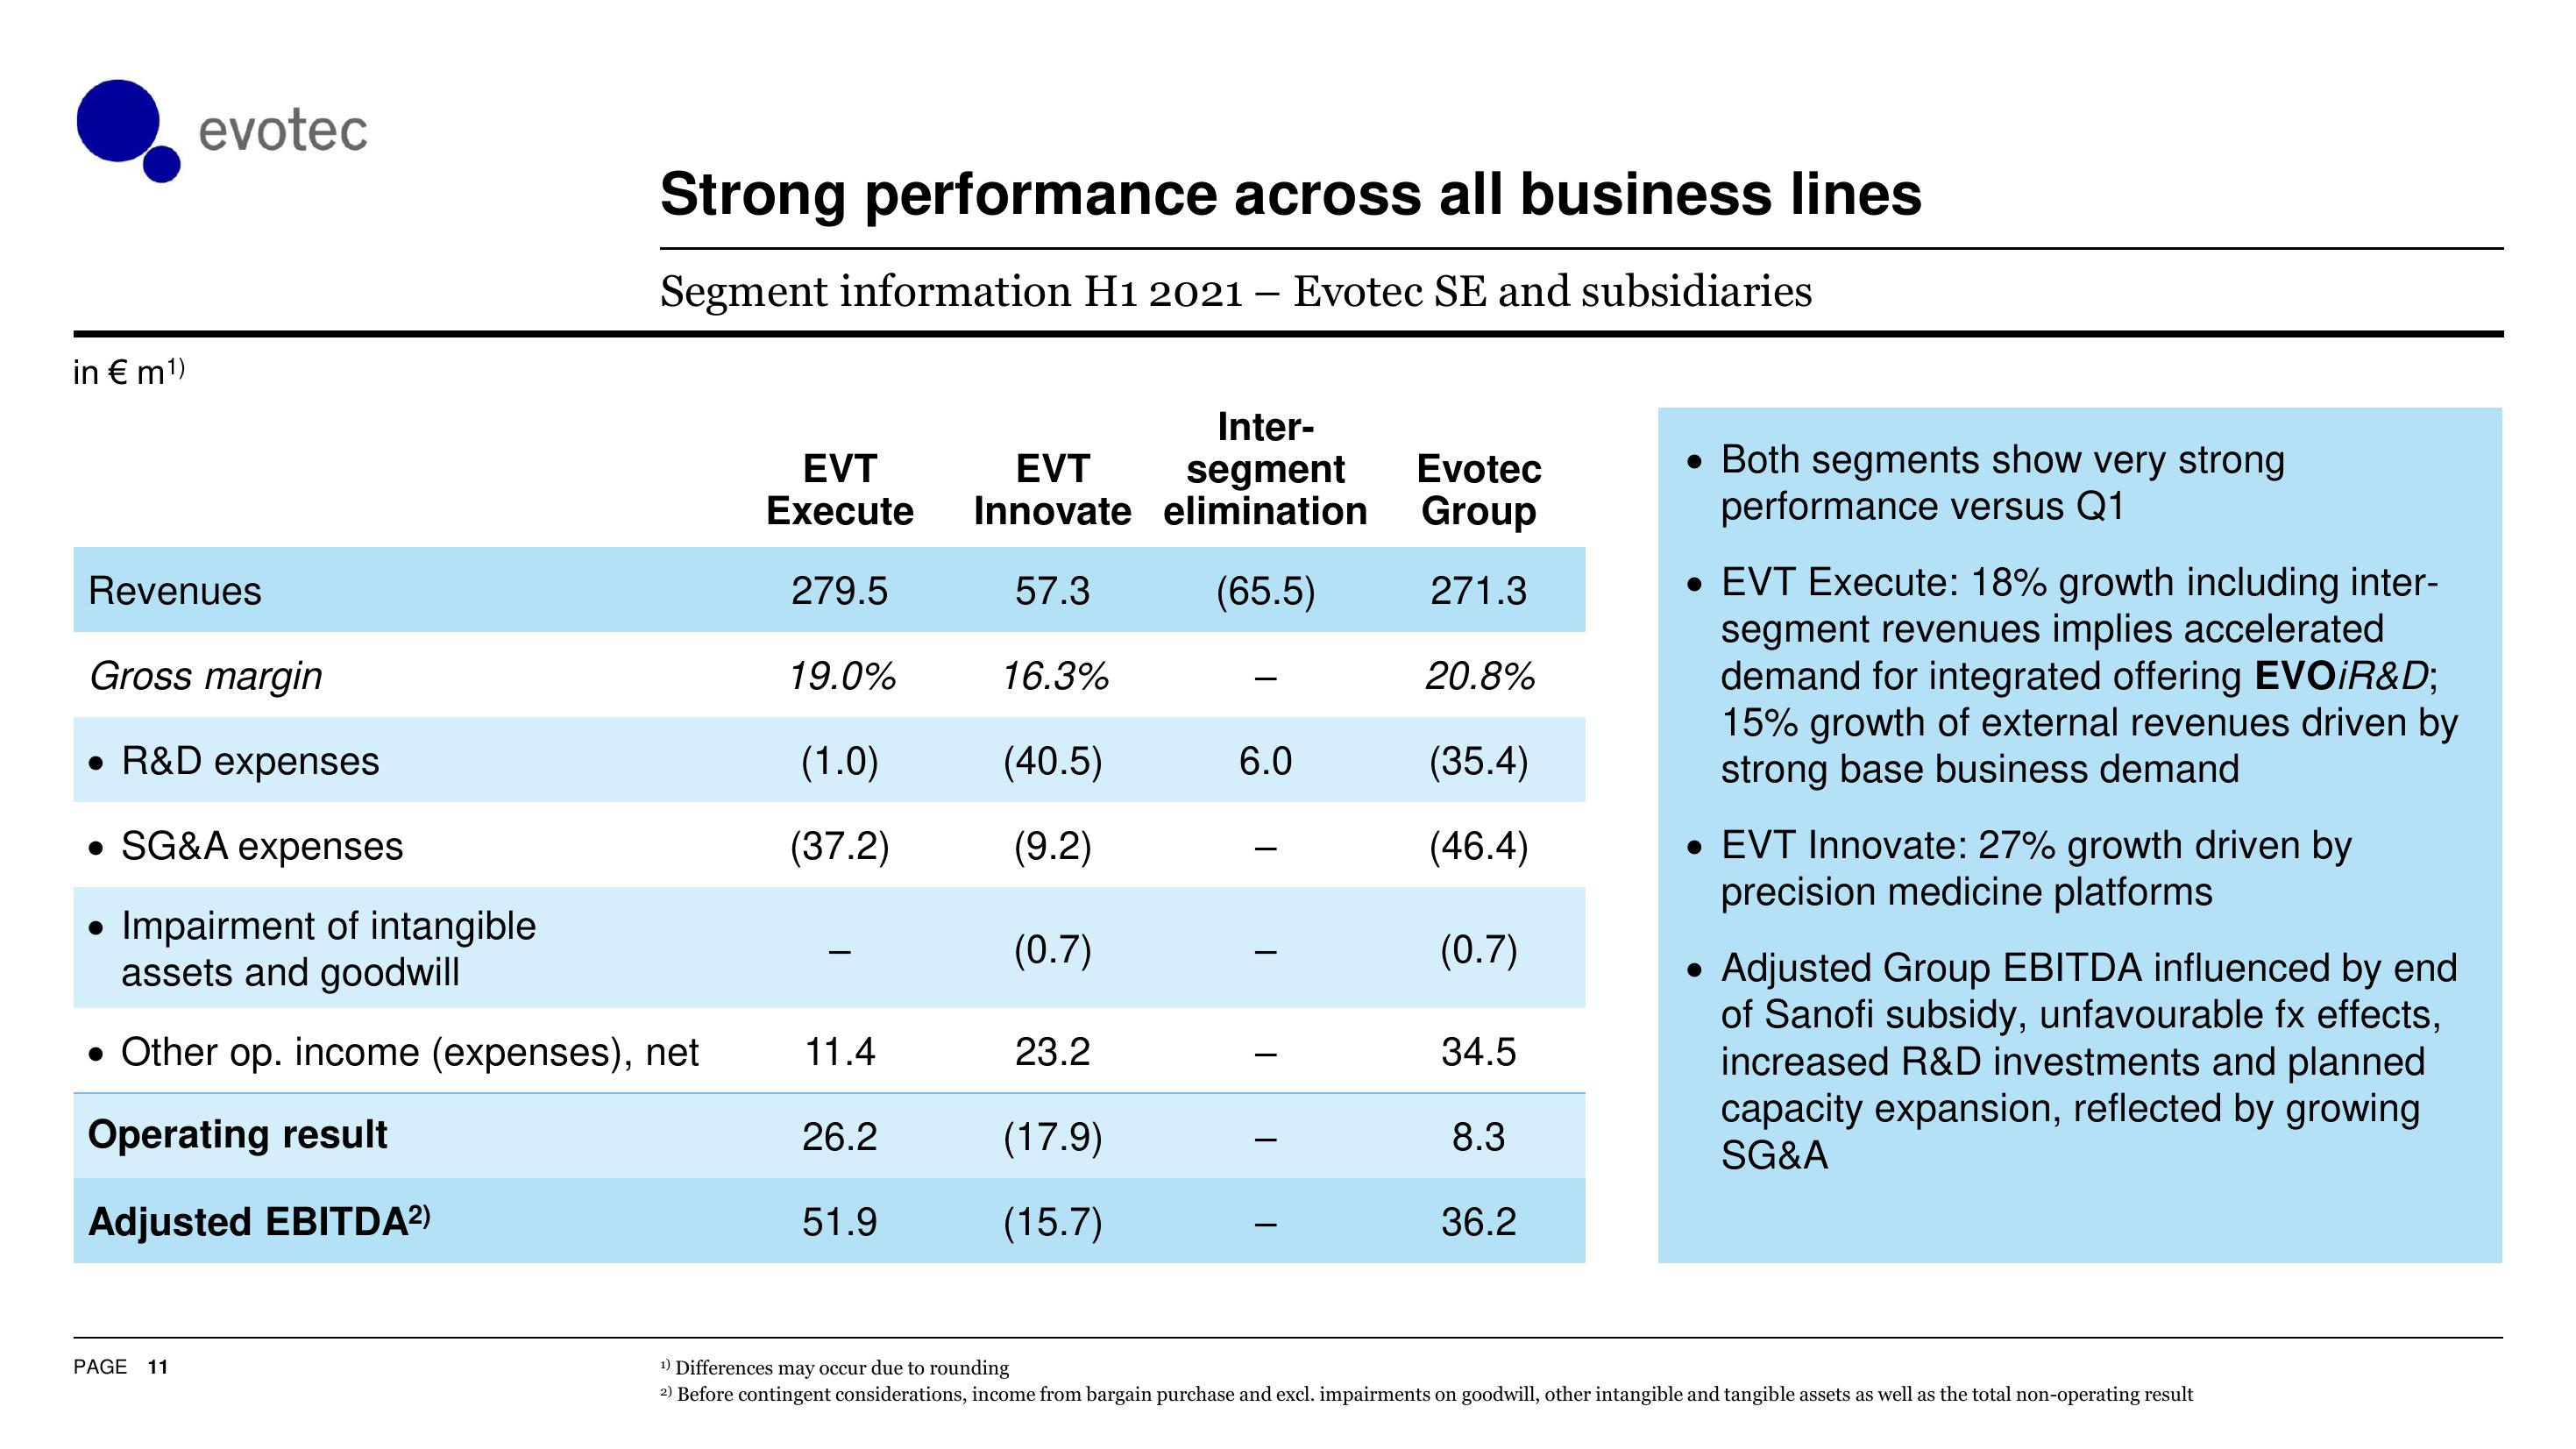
. Both segments show very strong
performance versus Q1
• EVT Execute: 18% growth including inter-
segment revenues implies accelerated
demand for integrated offering EVOIR&D;
15% growth of external revenues driven by
strong base business demand
• EVT Innovate: 27% growth driven by
precision medicine platforms
Adjusted Group EBITDA influenced by end
of Sanofi subsidy, unfavourable fx effects,
increased R&D investments and planned
capacity expansion, reflected by growing
SG&A
¹) Differences may occur due to rounding
2) Before contingent considerations, income from bargain purchase and excl. impairments on goodwill, other intangible and tangible assets as well as the total non-operating resultView entire presentation