Evercore Investment Banking Pitch Book
Preliminary Valuation of SIRE Common Units
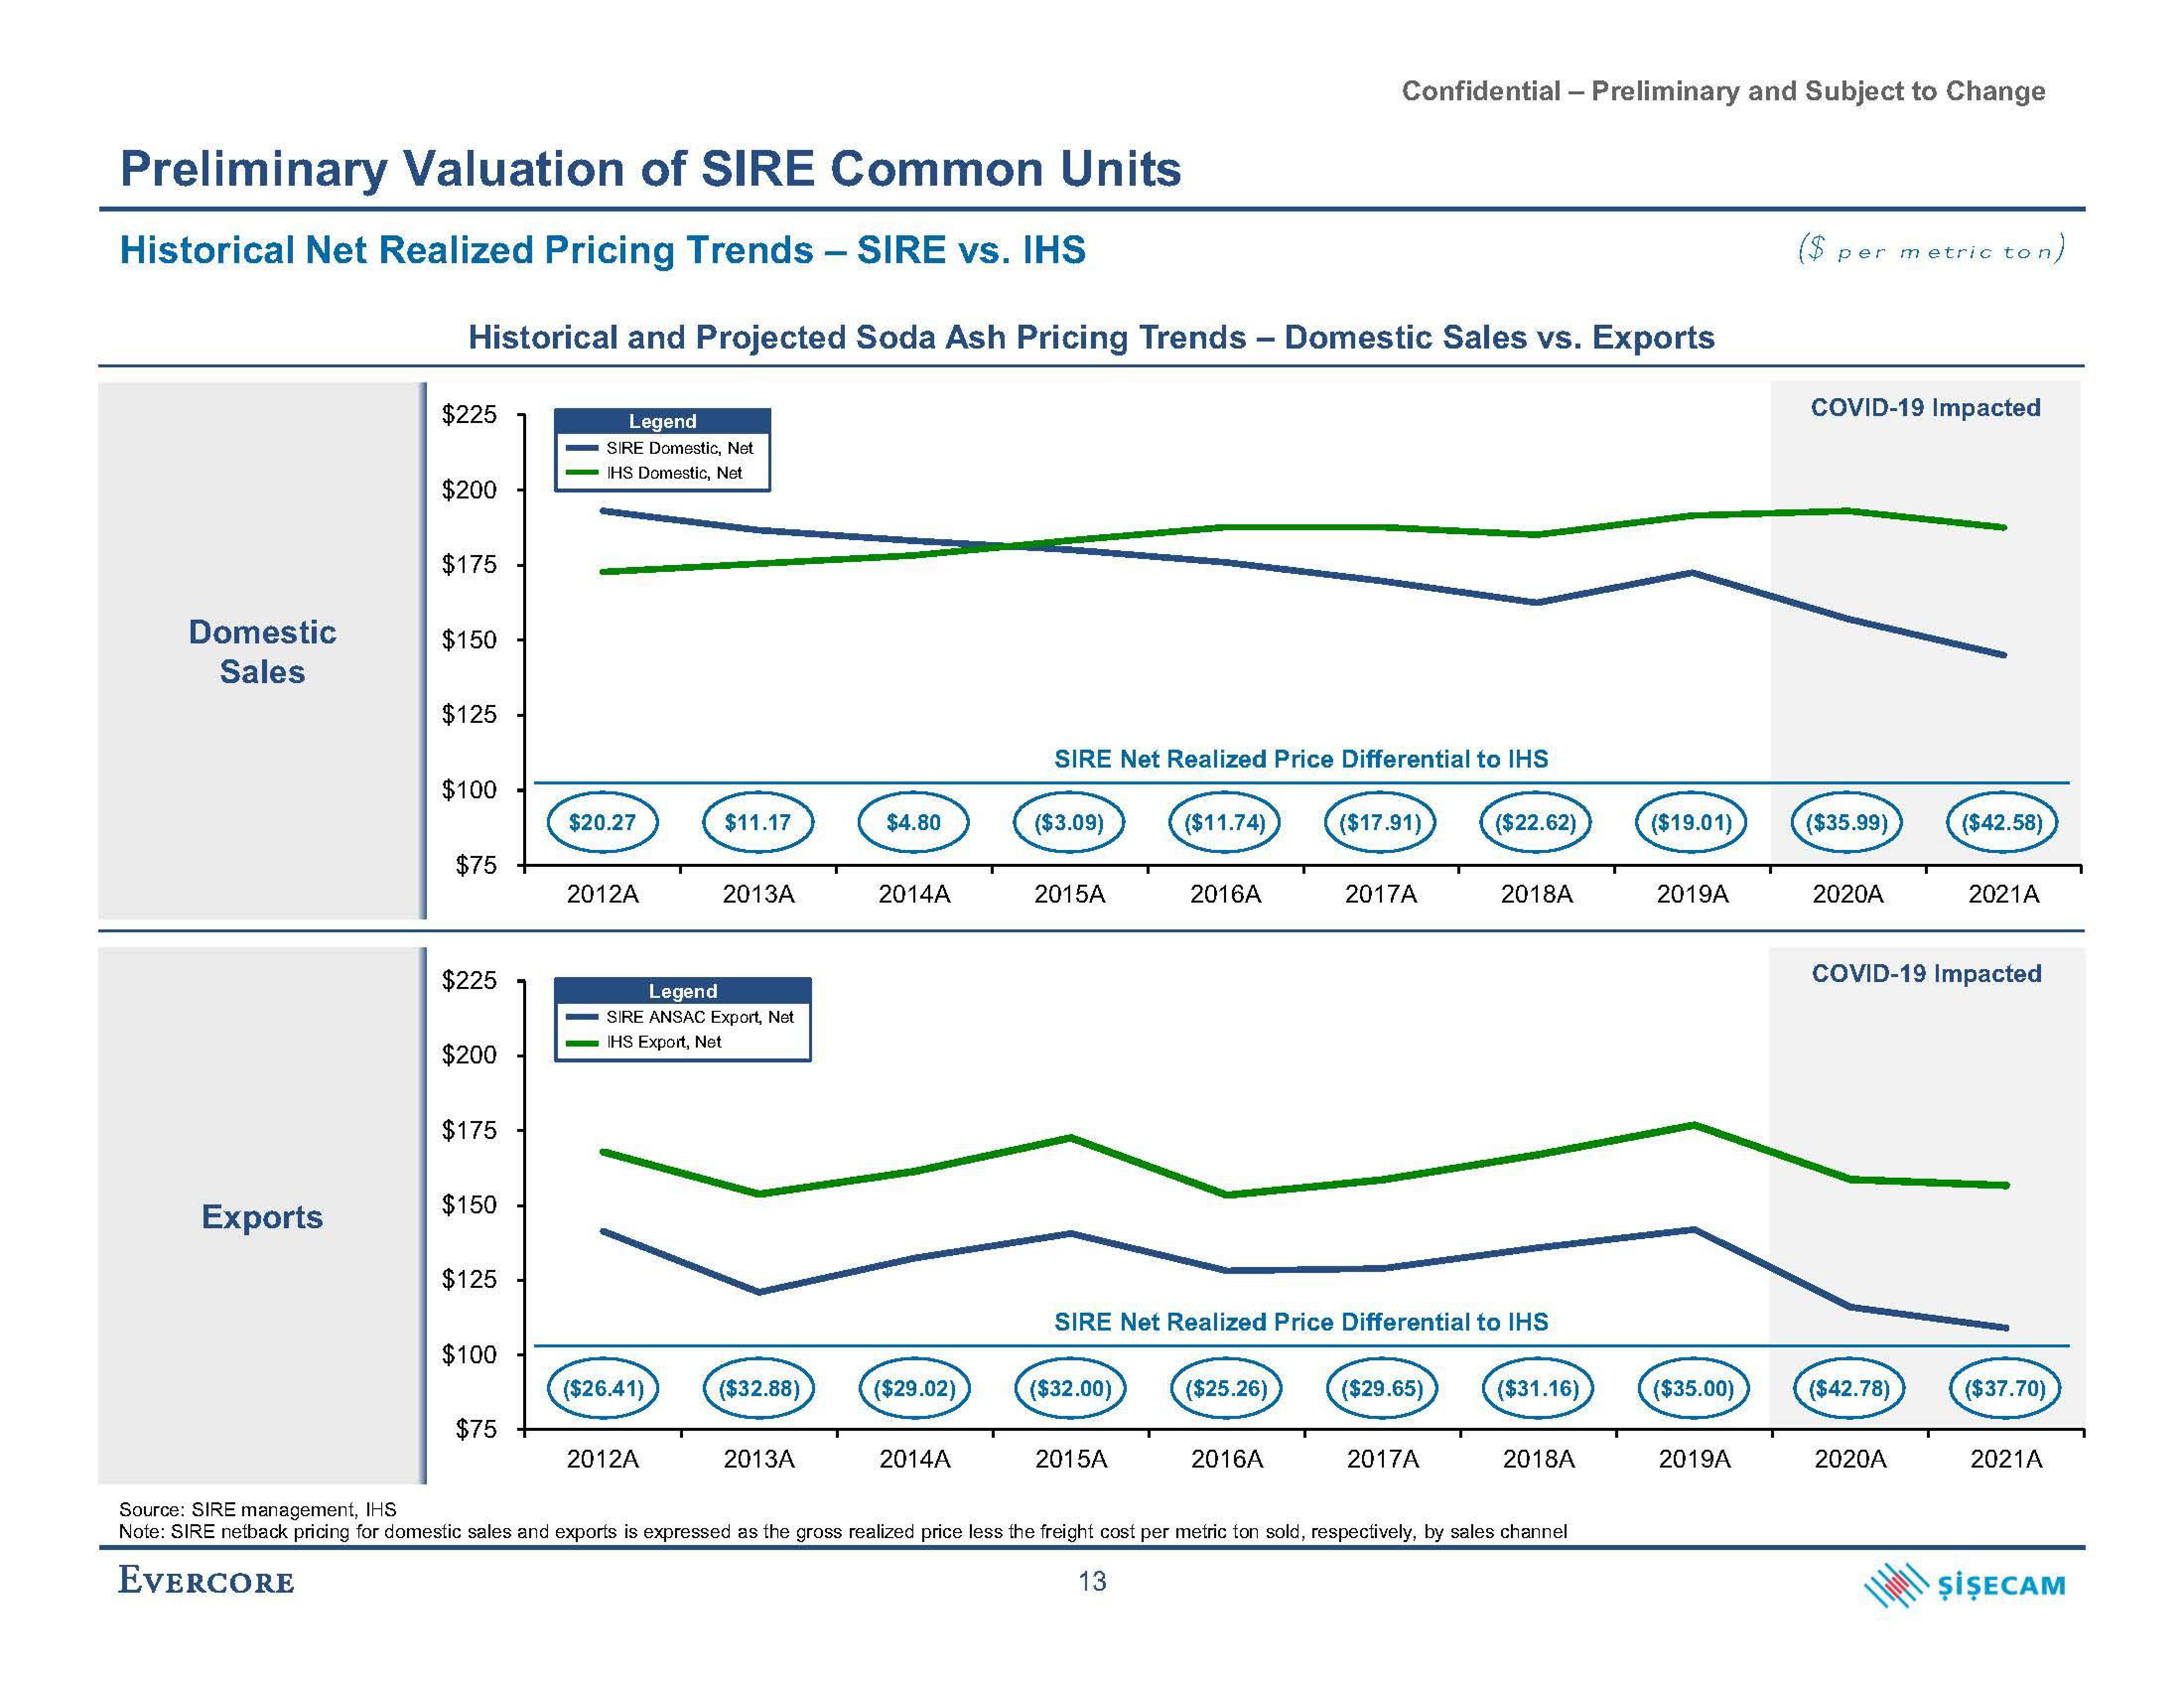
Historical Net Realized Pricing Trends - SIRE vs. IHS
Domestic
Sales
Exports
Historical and Projected Soda Ash Pricing Trends - Domestic Sales vs. Exports
$225
$200
$175
$150
$125
$100
$75
$225
$200
$175
$150
$125
$100
$75
Legend
SIRE Domestic, Net
IHS Domestic, Net
$20.27
2012A
($26.41)
$11.17
Legend
SIRE ANSAC Export, Net
IHS Export, Net
2012A
2013A
($32.88)
2013A
$4.80
2014A
($29.02)
2014A
SIRE Net Realized Price Differential to IHS
($3.09)
2015A
($32.00)
($11.74)
2015A
2016A
Confidential - Preliminary and Subject to Change
($25.26)
2016A
($17.91)
SIRE Net Realized Price Differential to IHS
2017A
($29.65)
($22.62)
2017A
2018A
($31.16)
2018A
Source: SIRE management, IHS
Note: SIRE netback pricing for domestic sales and exports is expressed as the gross realized price less the freight cost per metric ton sold, respectively, by sales channel
EVERCORE
13
($19.01)
2019A
($35.00)
2019A
per metric ton)
COVID-19 Impacted
($35.99)
2020A
($42.78)
($42.58)
COVID-19 Impacted
2020A
2021A
($37.70)
2021A
ŞİŞECAMView entire presentation