Silicon Valley Bank Results Presentation Deck
40,000
35,000
30,000
25,000
20,000
15,000
10,000
5,000
0
Continue to see strength and momentum in underlying business,
despite market challenges
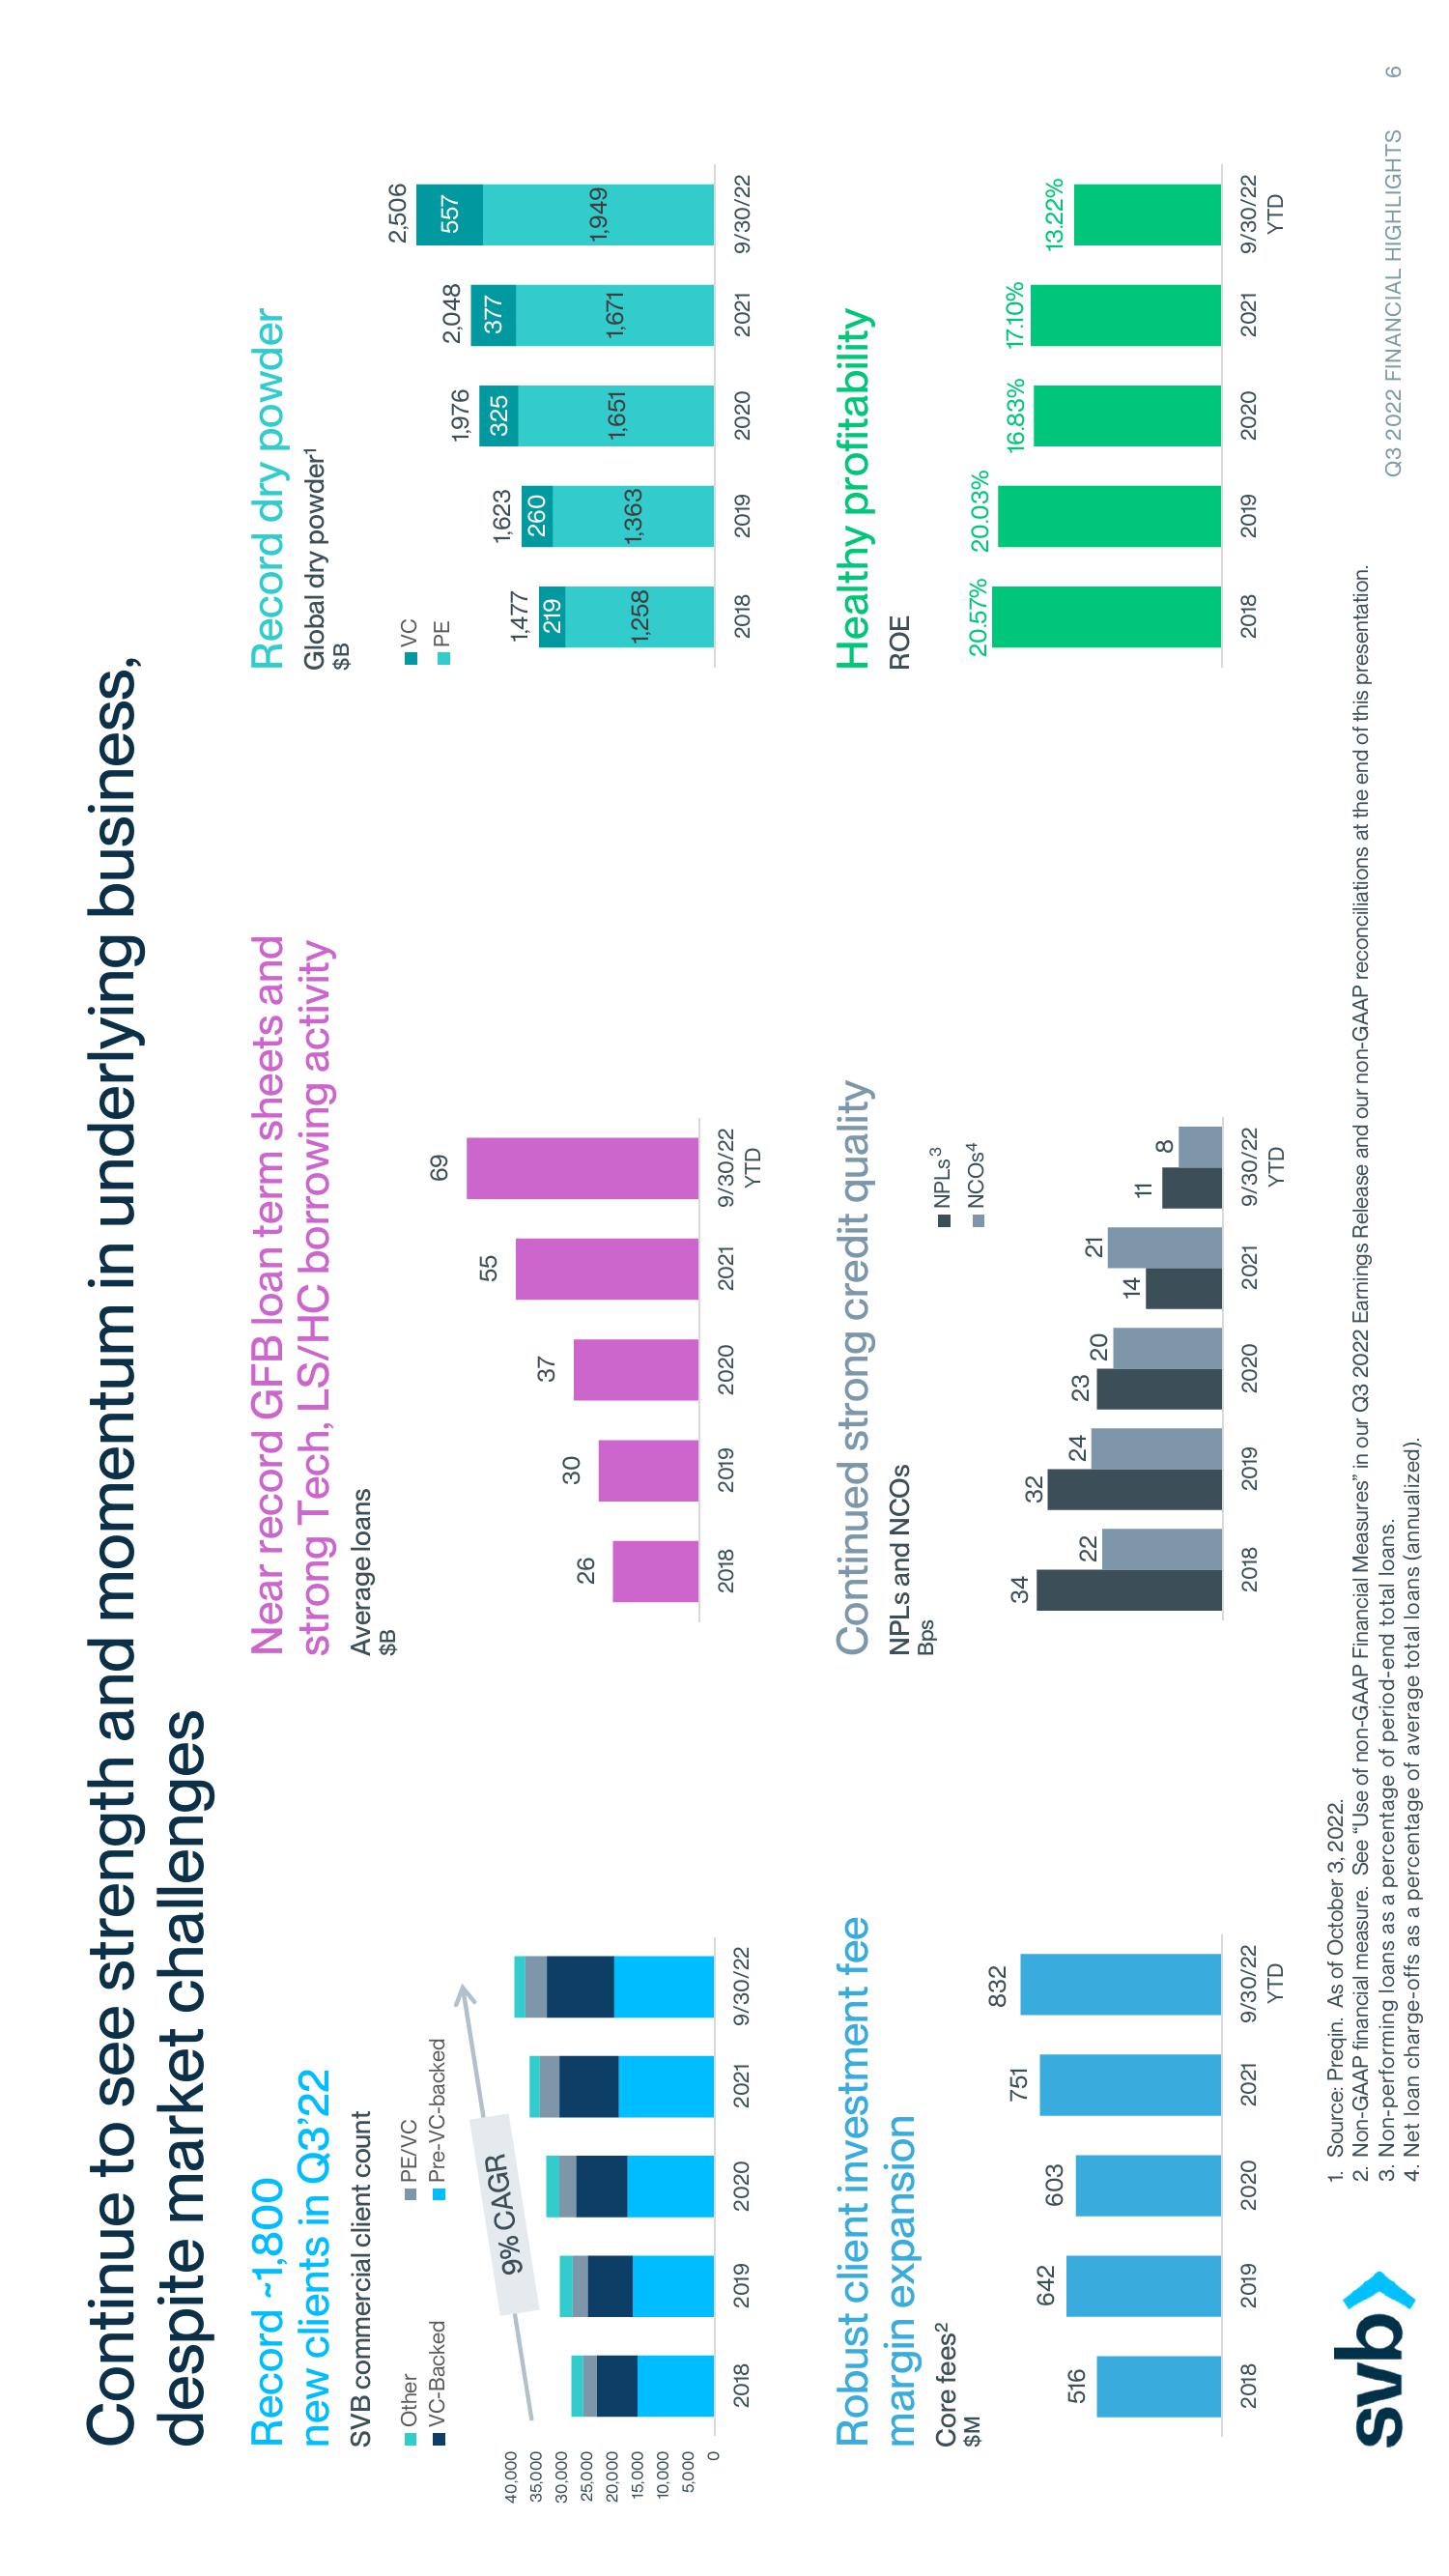
Record -1,800
new clients in Q3'22
SVB commercial client count
PE/VC
■ Other
■VC-Backed
2018
Core fees²
$M
516
2018
9% CAGR
2019
Robust client investment fee
margin expansion
642
Pre-VC-backed
2019
svb>
2020
603
2021 9/30/22
2020
751
2021
832
9/30/22
YTD
Near record GFB loan term sheets and
strong Tech, LS/HC borrowing activity
Average loans
$B
26
2018
34
22
30
2018
2019
32
24
37
Continued strong credit quality
NPLs and NCOS
Bps
2019
2020
23
20
55
2020
2021
14
21
69
2021
9/30/22
YTD
NPLs ³
■NCOS4
11
8
9/30/22
YTD
Record dry powder
Global dry powder¹
$B
■VC
■PE
1,477
219
1,258
2018
1,623
260
2018
1,363
1. Source: Preqin. As of October 3, 2022.
2. Non-GAAP financial measure. See "Use of non-GAAP Financial Measures" in our Q3 2022 Earnings Release and our non-GAAP reconciliations at the end of this presentation.
3. Non-performing loans as a percentage of period-end total loans.
4. Net loan charge-offs as a percentage of average total loans (annualized).
2019
1,976
325
2019
1,651 1,671
2020
Healthy profitability
ROE
2,048 557
377
2,506
20.57% 20.03%
16.83% 17.10%
Ilmi
2020
1,949
2021 9/30/22
13.22%
2021 9/30/22
YTD
Q3 2022 FINANCIAL HIGHLIGHTS 6View entire presentation