Getty SPAC Presentation Deck
Q3 at a Glance
($ in millions)
% YoY growth
% subscription
($ in millions)
% YoY growth
% margin
$203
Q3 '19
45.1%
$62
Q3 '19
30.5%
Revenue
CAGR: 7.6%
$206
Q3 '20
1.8%
46.0%
Adj. EBITDA
CAGR: 13.3%
$76
Q3 '20
23.1%
36.9%
$235
Q3 '21
13.7%
46.6%
$79
Q3 '21
4.3%
33.8%
% Growth vs Q3 '19
(pre-COVID):
15.8%
% Growth vs Q3 '19
(pre-COVID):
28.4%
●
Commentary
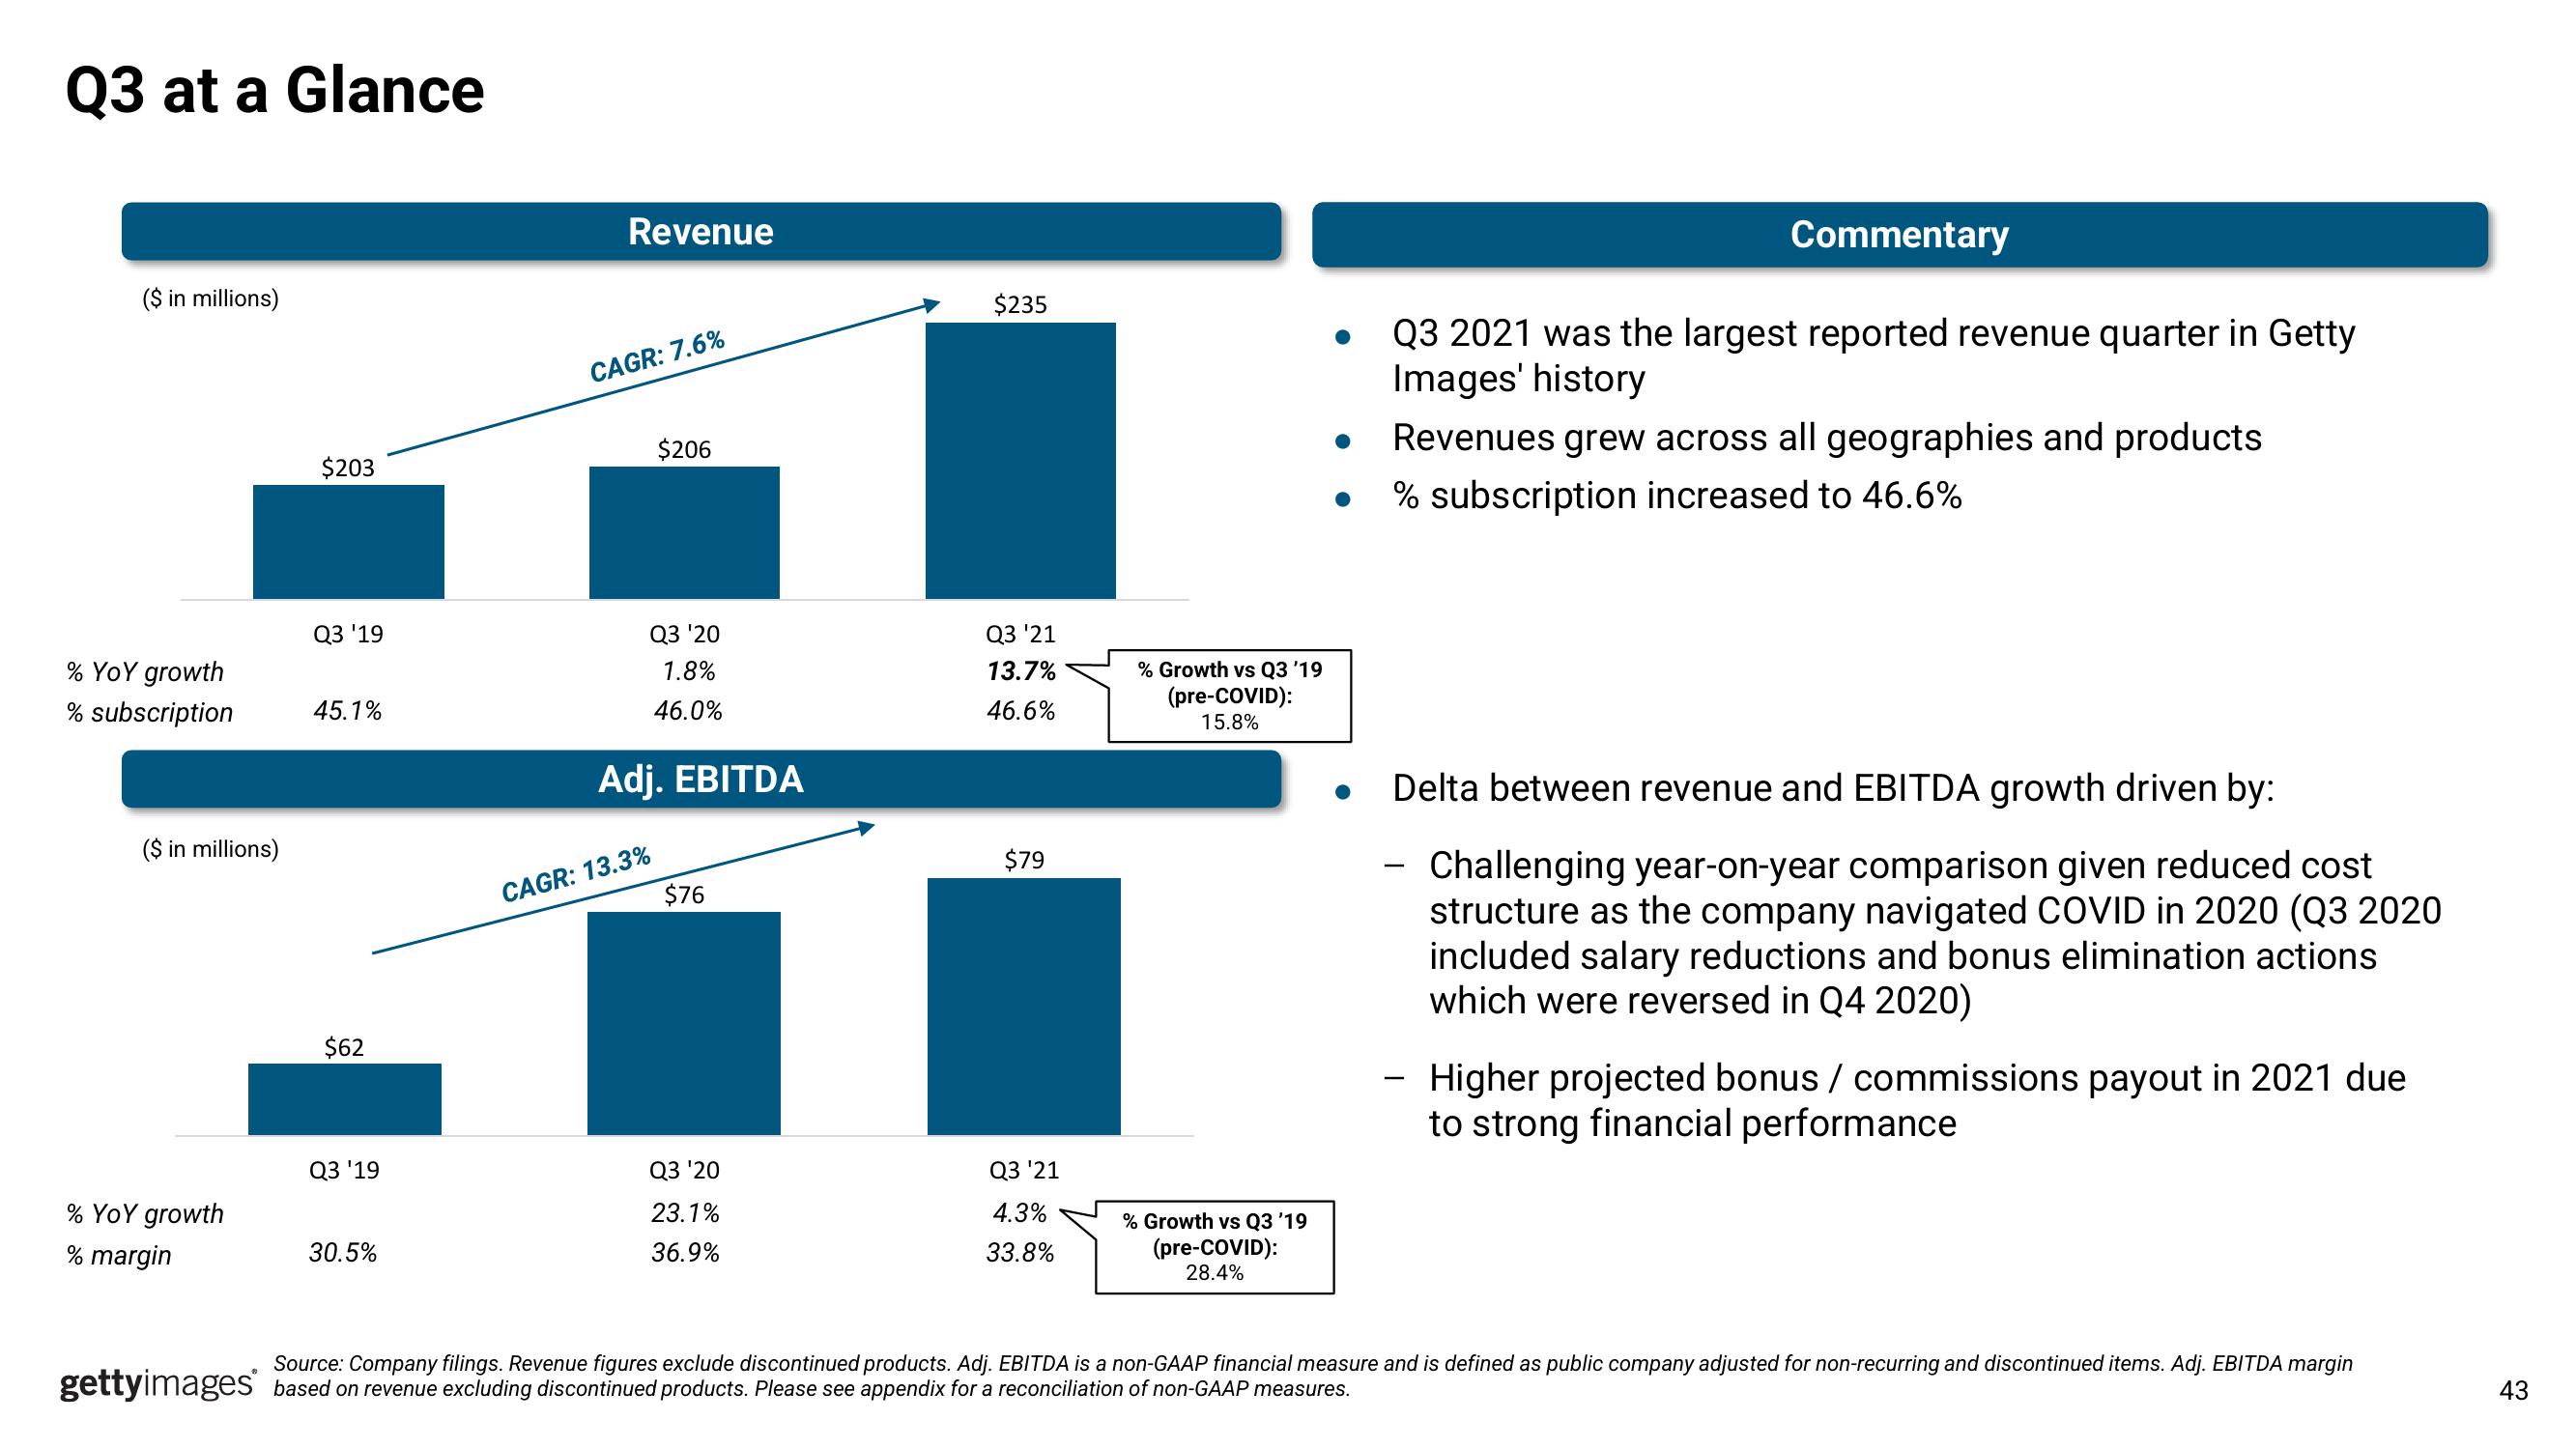
Q3 2021 was the largest reported revenue quarter in Getty
Images' history
Revenues grew across all geographies and products
% subscription increased to 46.6%
Delta between revenue and EBITDA growth driven by:
Challenging year-on-year comparison given reduced cost
structure as the company navigated COVID in 2020 (Q3 2020
included salary reductions and bonus elimination actions
which were reversed in Q4 2020)
-
Higher projected bonus / commissions payout in 2021 due
to strong financial performance
Source: Company filings. Revenue figures exclude discontinued products. Adj. EBITDA is a non-GAAP financial measure and is defined as public company adjusted for non-recurring and discontinued items. Adj. EBITDA margin
gettyimages based on revenue excluding discontinued products. Please see appendix for a reconciliation of non-GAAP measures.
43View entire presentation