Federal Signal Investor Presentation Deck
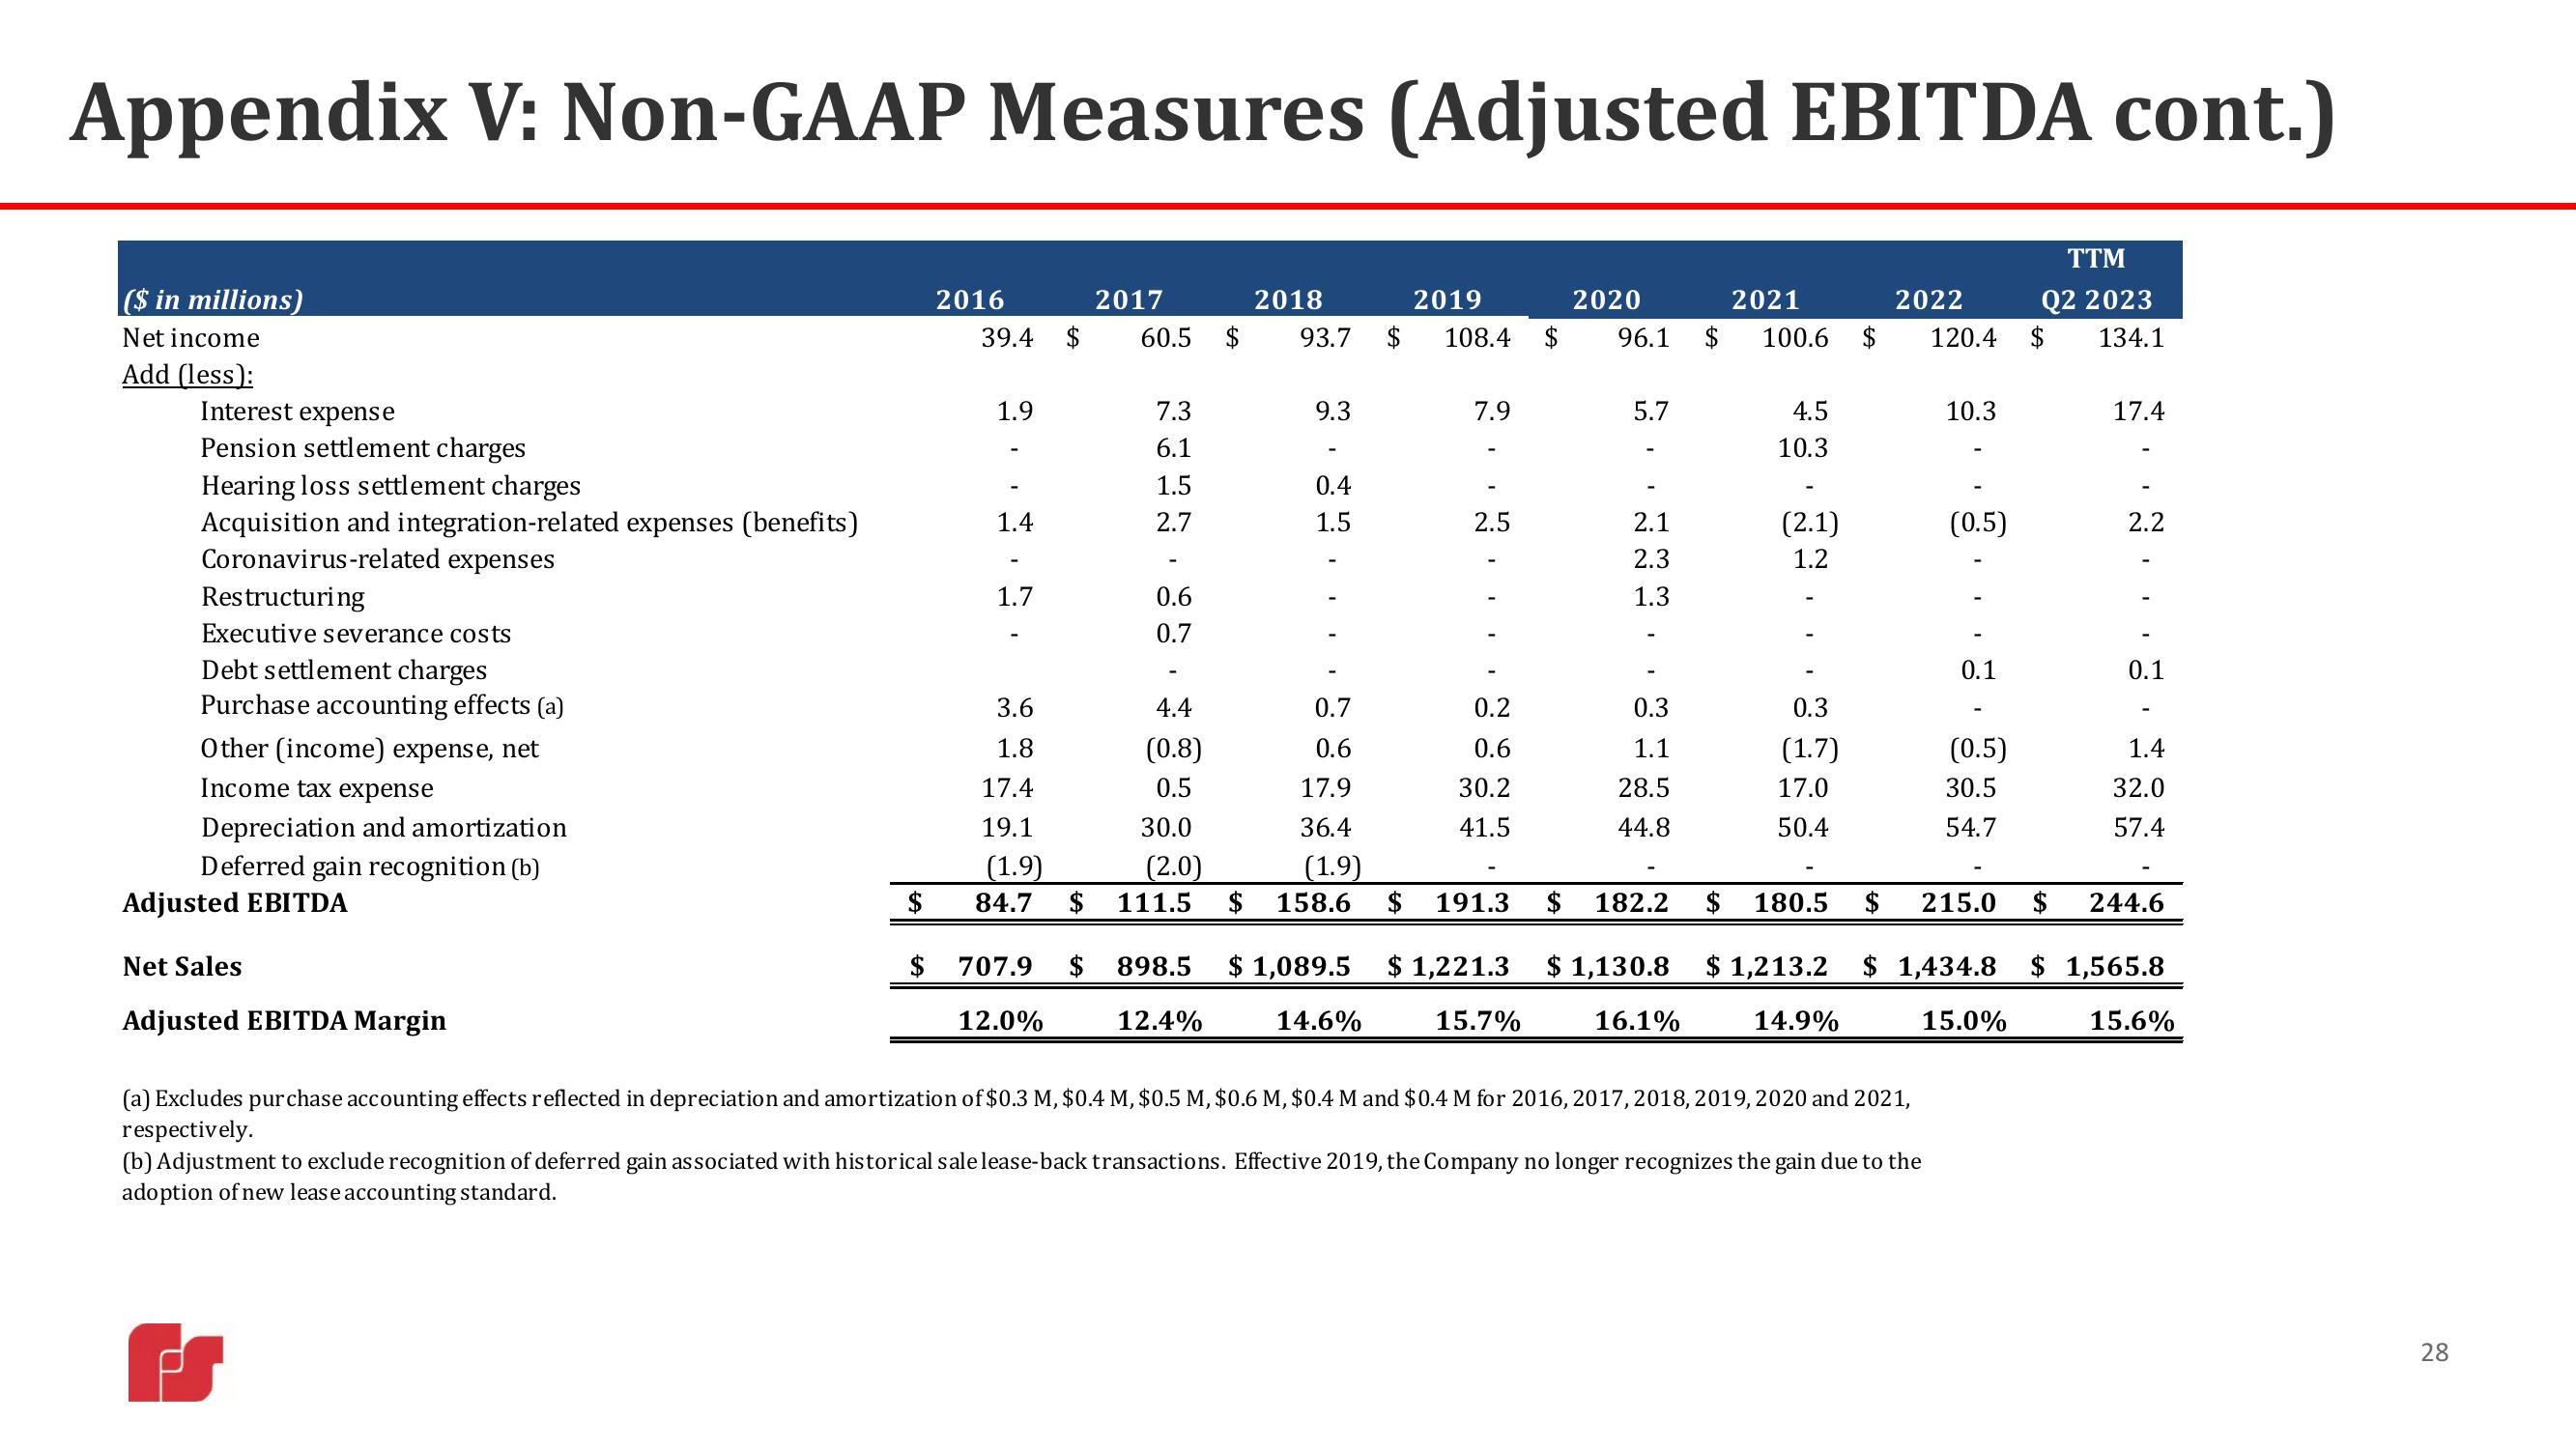
Appendix V: Non-GAAP Measures (Adjusted EBITDA cont.)
($ in millions)
Net income
Add (less):
Interest expense
Pension settlement charges
Hearing loss settlement charges
Acquisition and integration-related expenses (benefits)
Coronavirus-related expenses
Restructuring
Executive severance costs
Debt settlement charges
Purchase accounting effects (a)
Other (income) expense, net
Income tax expense
Depreciation and amortization
Deferred gain recognition (b)
Adjusted EBITDA
Net Sales
Adjusted EBITDA Margin
n
$
$
2016
39.4 $
1.9
1.4
1.7
2017
60.5
7.3
6.1
1.5
2.7
0.6
0.7
1
3.6
1.8
17.4
19.1
30.0
(1.9)
(2.0)
84.7 $ 111.5
4.4
(0.8)
0.5
$
2018
93.7
9.3
0.4
1.5
0.7
0.6
17.9
36.4
(1.9)
$ 158.6
707.9 $ 898.5 $ 1,089.5
14.6%
12.0%
12.4%
2019
$ 108.4 $
7.9
2.5
0.2
0.6
30.2
41.5
-
$ 191.3
$1,221.3
15.7%
2020
2021
96.1 $ 100.6
5.7
2.1
2.3
1.3
0.3
1.1
28.5
44.8
$1,130.8
4.5
10.3
16.1%
(2.1)
1.2
0.3
(1.7)
17.0
50.4
$ 182.2 $ 180.5 $
$ 1,213.2
14.9%
$
2022
(a) Excludes purchase accounting effects reflected in depreciation and amortization of $0.3 M, $0.4 M, $0.5 M, $0.6 M, $0.4 M and $0.4 M for 2016, 2017, 2018, 2019, 2020 and 2021,
respectively.
TTM
Q2 2023
120.4 $ 134.1
(b) Adjustment to exclude recognition of deferred gain associated with historical sale lease-back transactions. Effective 2019, the Company no longer recognizes the gain due to the
adoption of new lease accounting standard.
10.3
(0.5)
0.1
(0.5)
30.5
54.7
17.4
2.2
0.1
1.4
32.0
57.4
215.0 $ 244.6
1,434.8 $ 1,565.8
15.6%
15.0%
28View entire presentation