Investor Presentation
High-Quality Balance Sheet and Cash Flow Management
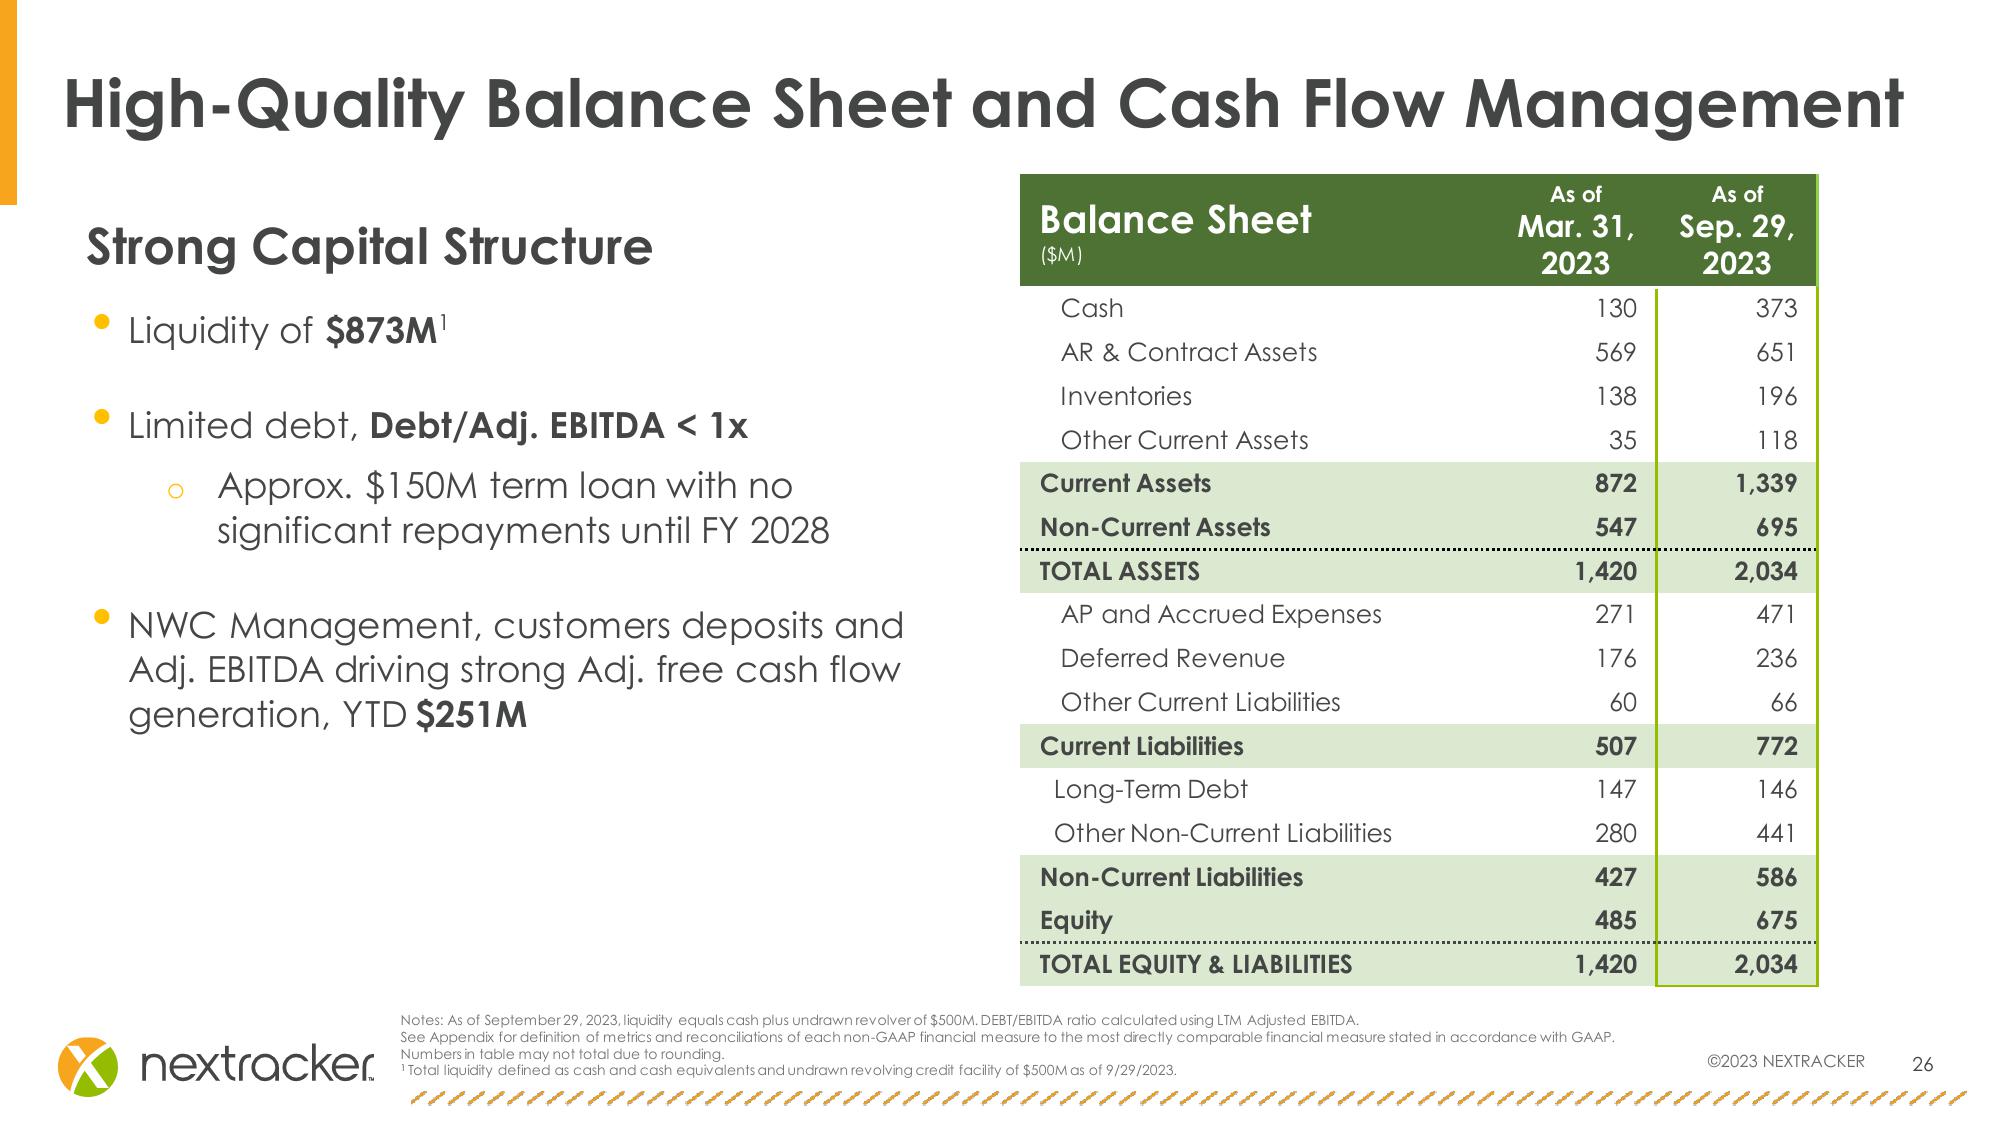
Strong Capital Structure
Balance Sheet
($M)
Cash
Liquidity of $873M¹
Limited debt, Debt/Adj. EBITDA < 1x
Approx. $150M term loan with no
significant repayments until FY 2028
NWC Management, customers deposits and
Adj. EBITDA driving strong Adj. free cash flow
generation, YTD $251M
As of
Mar. 31,
As of
Sep. 29,
2023
2023
130
373
AR & Contract Assets
569
651
Inventories
138
196
Other Current Assets
35
118
Current Assets
872
1,339
Non-Current Assets
547
695
TOTAL ASSETS
1,420
2,034
AP and Accrued Expenses
271
471
Deferred Revenue
176
236
Other Current Liabilities
60
66
Current Liabilities
507
772
Long-Term Debt
147
146
Other Non-Current Liabilities
280
441
Non-Current Liabilities
427
586
Equity
485
675
TOTAL EQUITY & LIABILITIES
1,420
2,034
Notes: As of September 29, 2023, liquidity equals cash plus undrawn revolver of $500M. DEBT/EBITDA ratio calculated using LTM Adjusted EBITDA.
See Appendix for definition of metrics and reconciliations of each non-GAAP financial measure to the most directly comparable financial measure stated in accordance with GAAP.
Numbers in table may not total due to rounding..
nextracker.
1 Total liquidity defined as cash and cash equivalents and undrawn revolving credit facility of $500M as of 9/29/2023.
©2023 NEXTRACKER
26View entire presentation