NVIDIA Investor Presentation Deck
Q3
FY24
Gross margin
($ in million)
Operating income
($ in million)
Net income
($ in million)
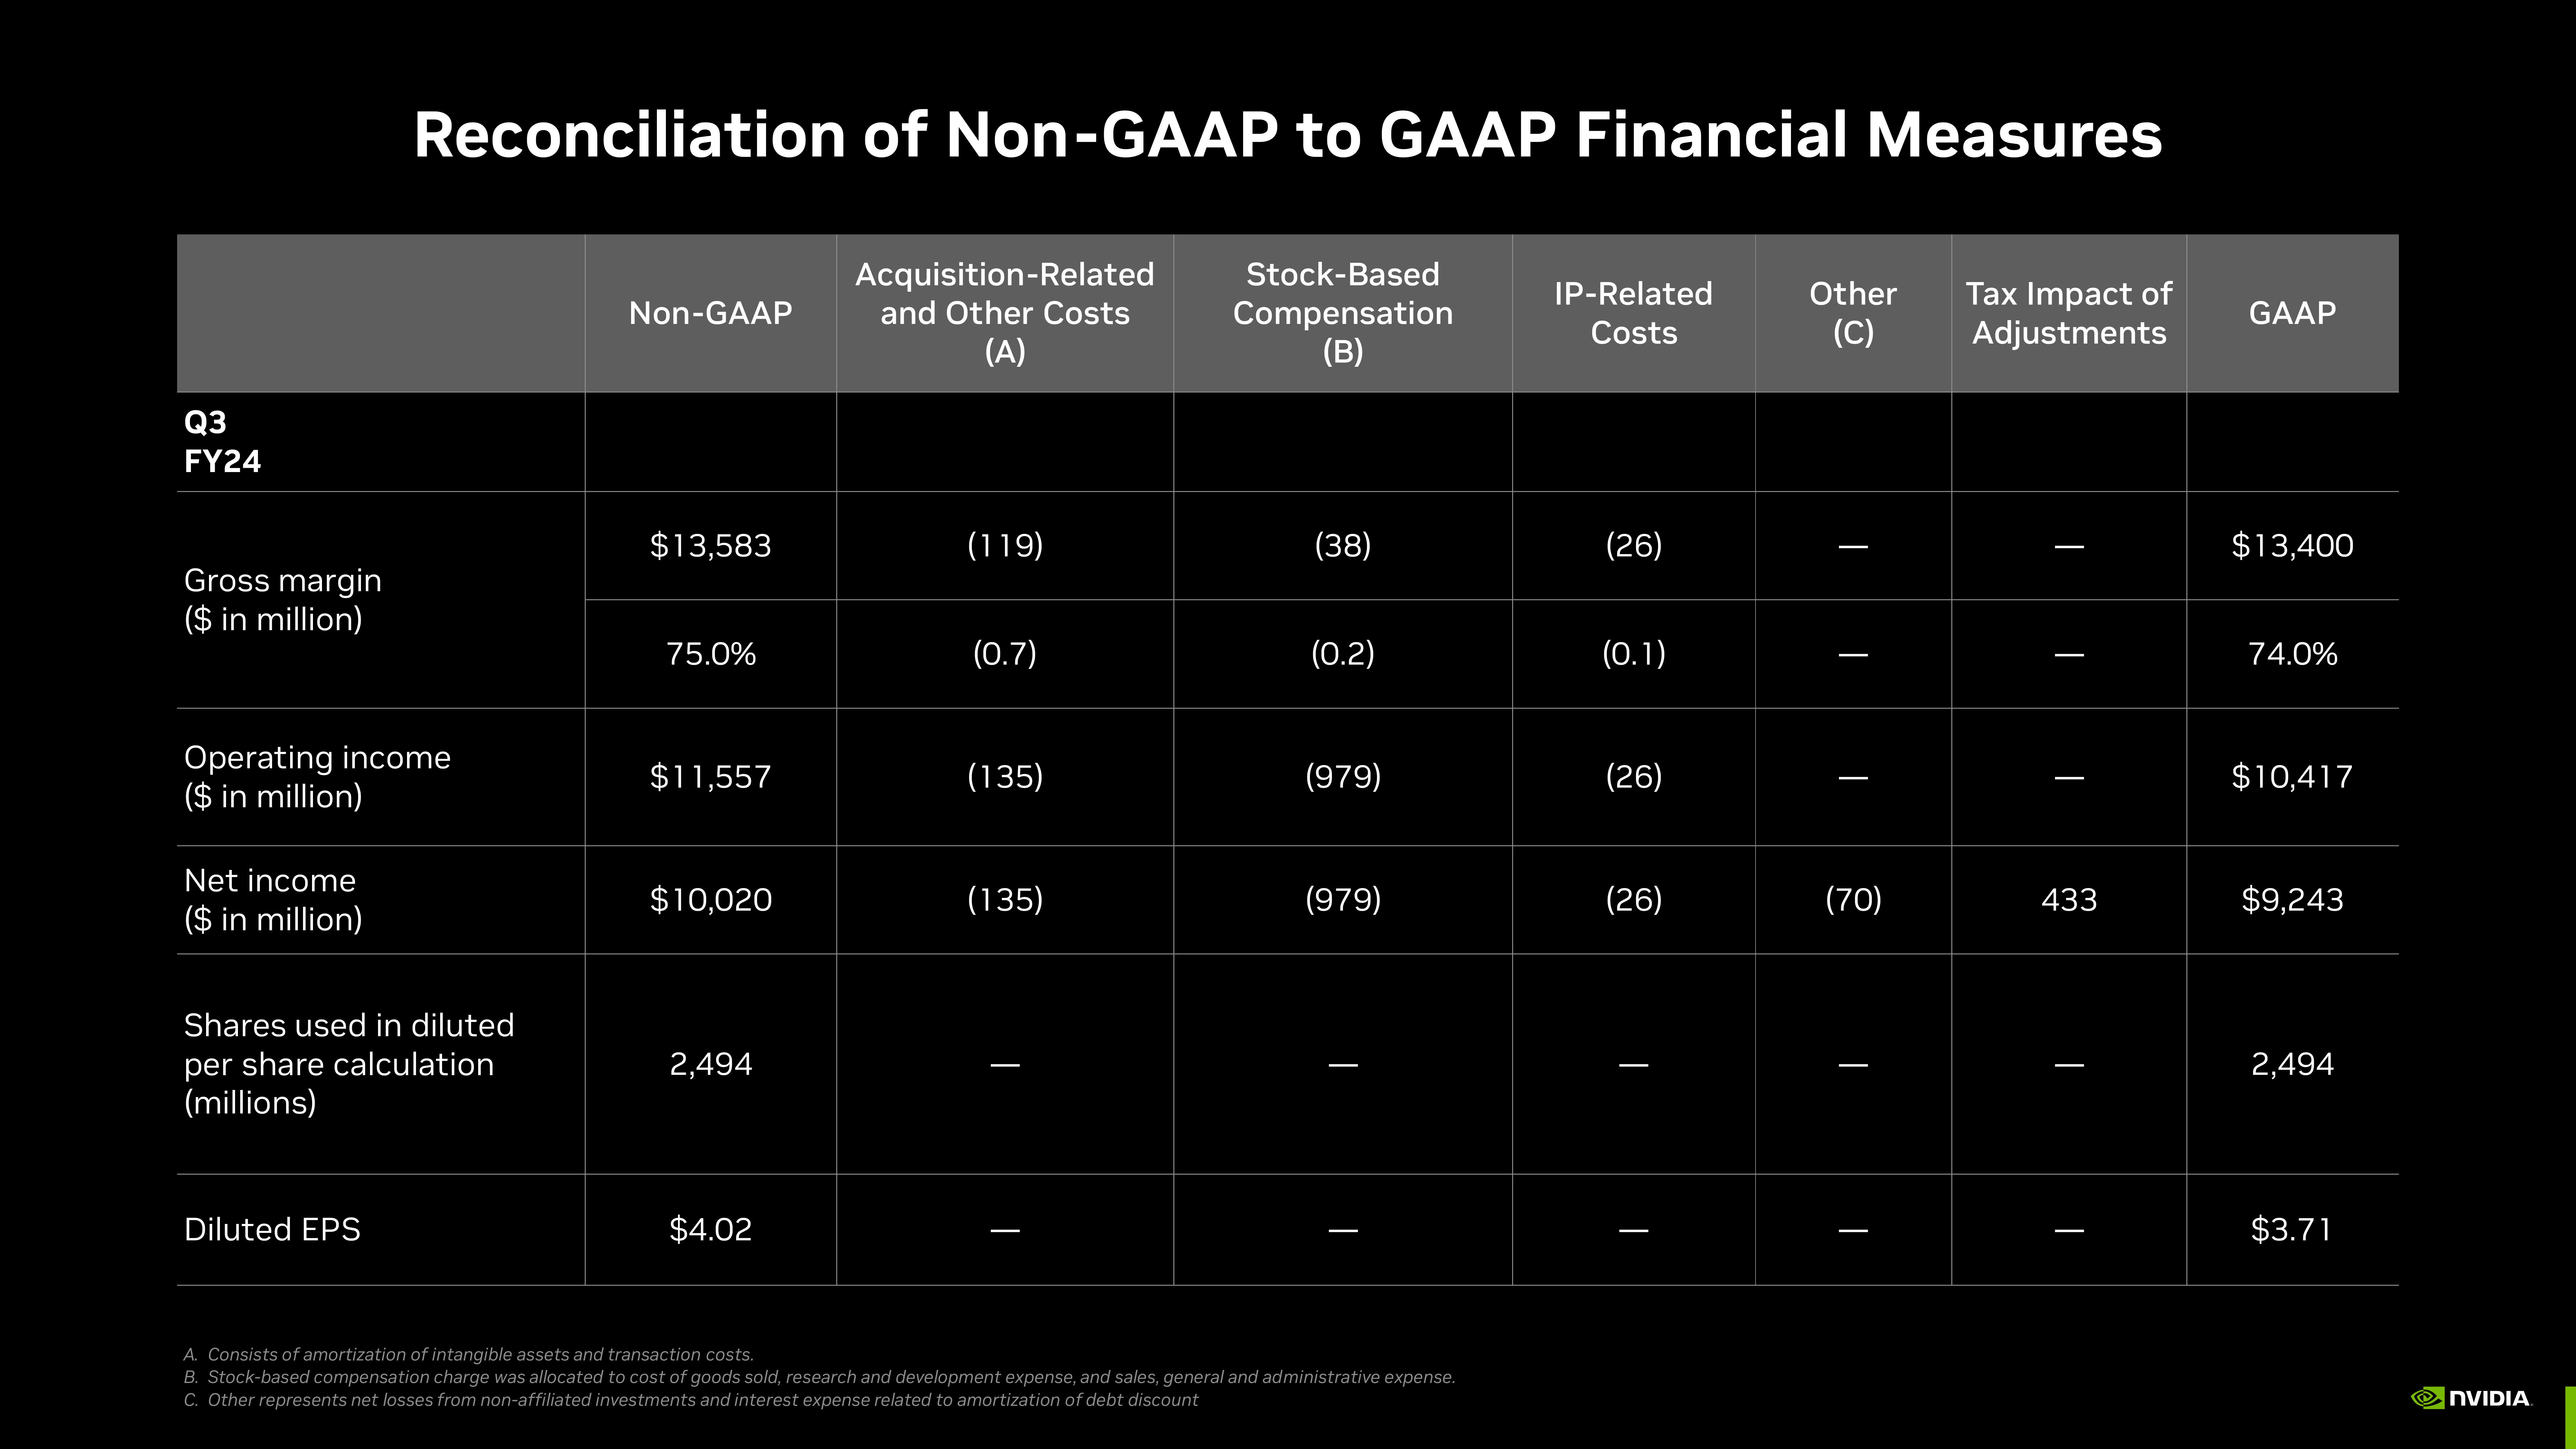
Reconciliation of Non-GAAP to GAAP Financial Measures
Shares used in diluted
per share calculation
(millions)
Diluted EPS
Non-GAAP
$13,583
75.0%
$11,557
$10,020
2,494
$4.02
Acquisition-Related
and Other Costs
(A)
(119)
(0.7)
(135)
(135)
Stock-Based
Compensation
(B)
(38)
(0.2)
(979)
(979)
|
A. Consists of amortization of intangible assets and transaction costs.
B. Stock-based compensation charge was allocated to cost of goods sold, research and development expense, and sales, general and administrative expense.
C. Other represents net losses from non-affiliated investments and interest expense related to amortization of debt discount
IP-Related
Costs
(26)
(0.1)
(26)
(26)
|
|
Other Tax Impact of
(C) Adjustments
|
T
| |
(70)
|
|
I
433
|
GAAP
$13,400
74.0%
$10,417
$9,243
2,494
$3.71
NVIDIA
|View entire presentation