TaskUs Investor Presentation Deck
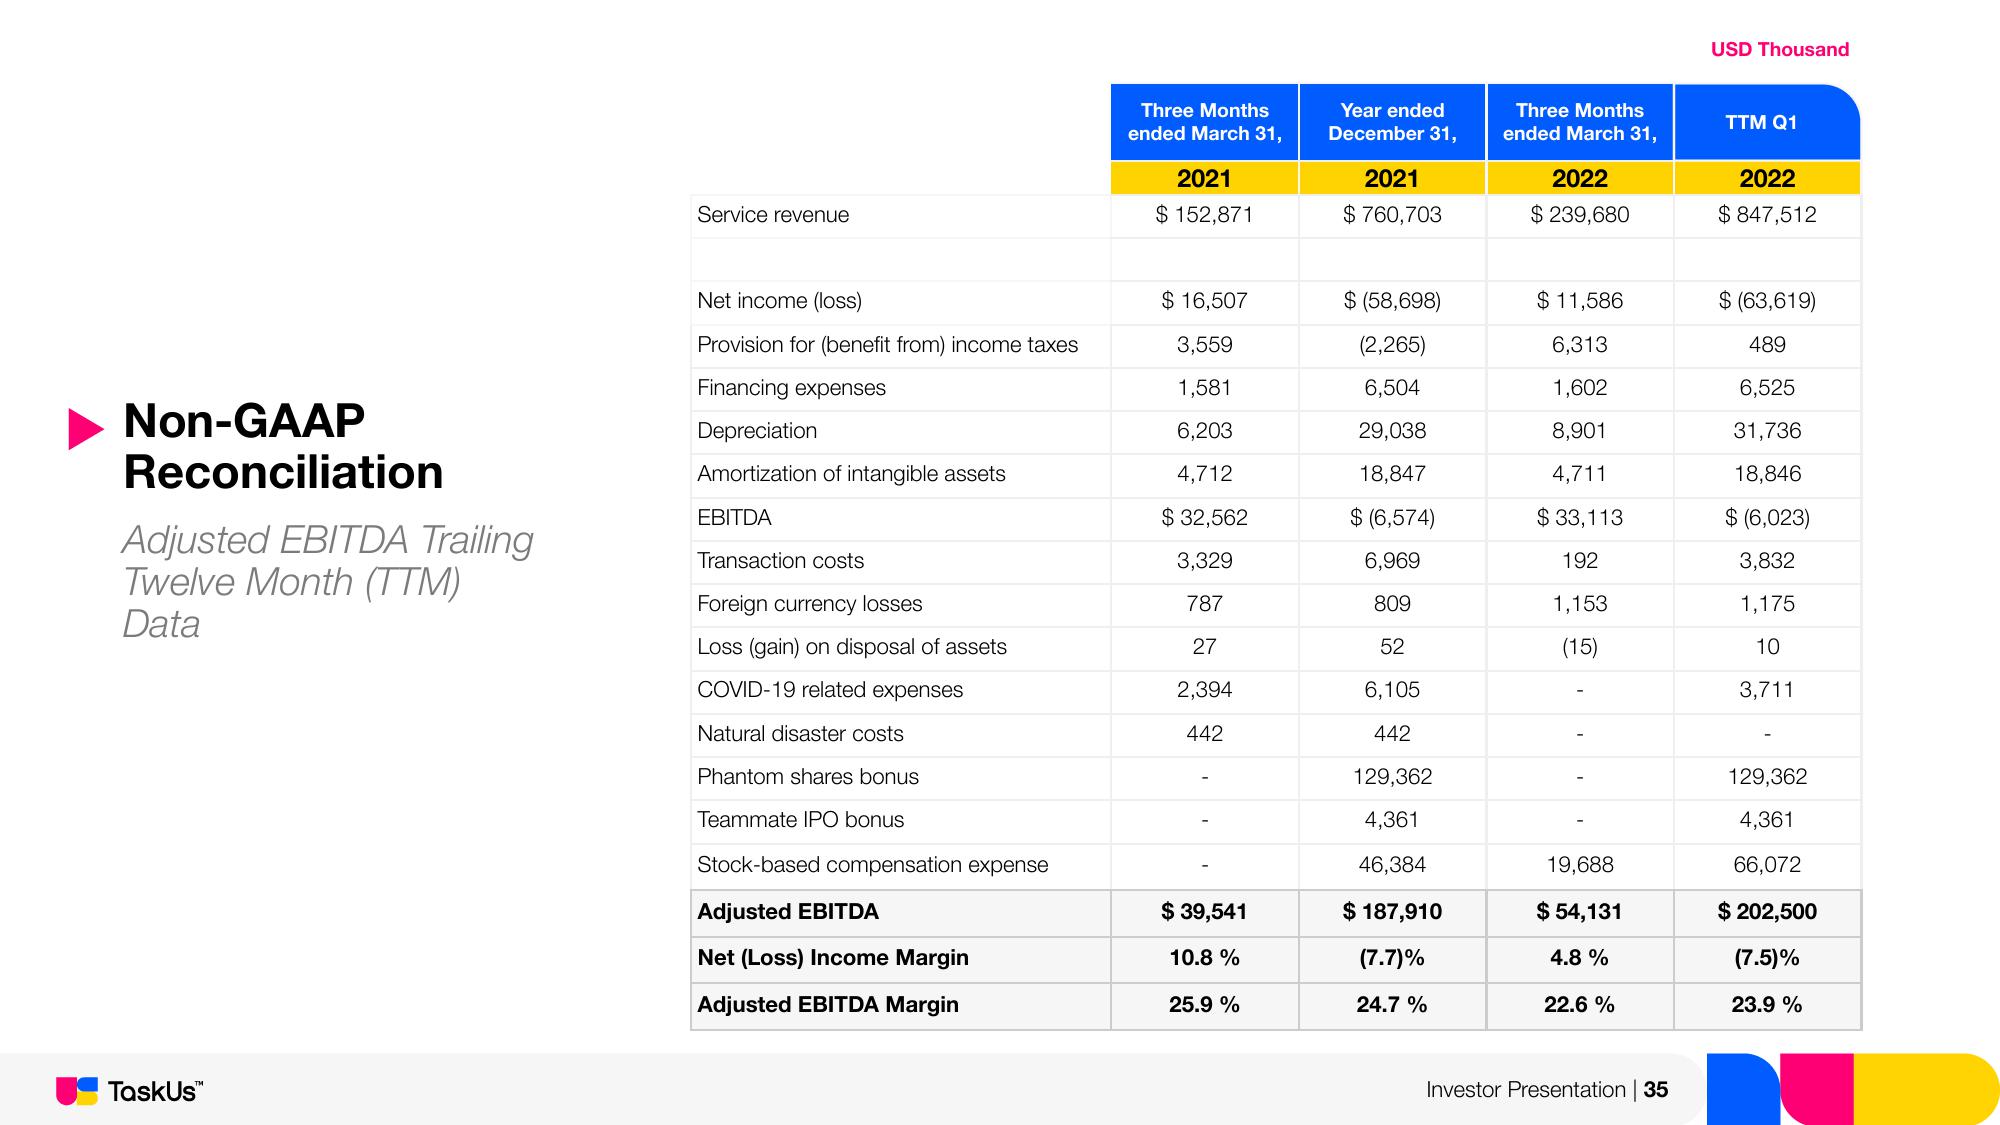
Non-GAAP
Reconciliation
Adjusted EBITDA Trailing
Twelve Month (TTM)
Data
TaskUs™
Service revenue
Net income (loss)
Provision for (benefit from) income taxes
Financing expenses
Depreciation
Amortization of intangible assets
EBITDA
Transaction costs
Foreign currency losses
Loss (gain) on disposal of assets
COVID-19 related expenses
Natural disaster costs
Phantom shares bonus
Teammate IPO bonus
Stock-based compensation expense
Adjusted EBITDA
Net (Loss) Income Margin
Adjusted EBITDA Margin
Three Months
ended March 31,
2021
$152,871
$ 16,507
3,559
1,581
6,203
4,712
$ 32,562
3,329
787
27
2,394
442
$ 39,541
10.8 %
25.9 %
Year ended
December 31,
2021
$760,703
$ (58,698)
(2,265)
6,504
29,038
18,847
$ (6,574)
6,969
809
52
6,105
442
129,362
4,361
46,384
$ 187,910
(7.7)%
24.7%
Three Months
ended March 31,
2022
$ 239,680
$11,586
6,313
1,602
8,901
4,711
$33,113
192
1,153
(15)
19,688
$ 54,131
4.8 %
22.6 %
Investor Presentation | 35
USD Thousand
TTM Q1
2022
$ 847,512
$ (63,619)
489
6,525
31,736
18,846
$ (6,023)
3,832
1,175
10
3,711
129,362
4,361
66,072
$ 202,500
(7.5)%
23.9 %View entire presentation