Goldman Sachs Results Presentation Deck
Loans and Net Interest Income
$178
$110
$49
$19
2Q23
$1,684
$202
$821
$661
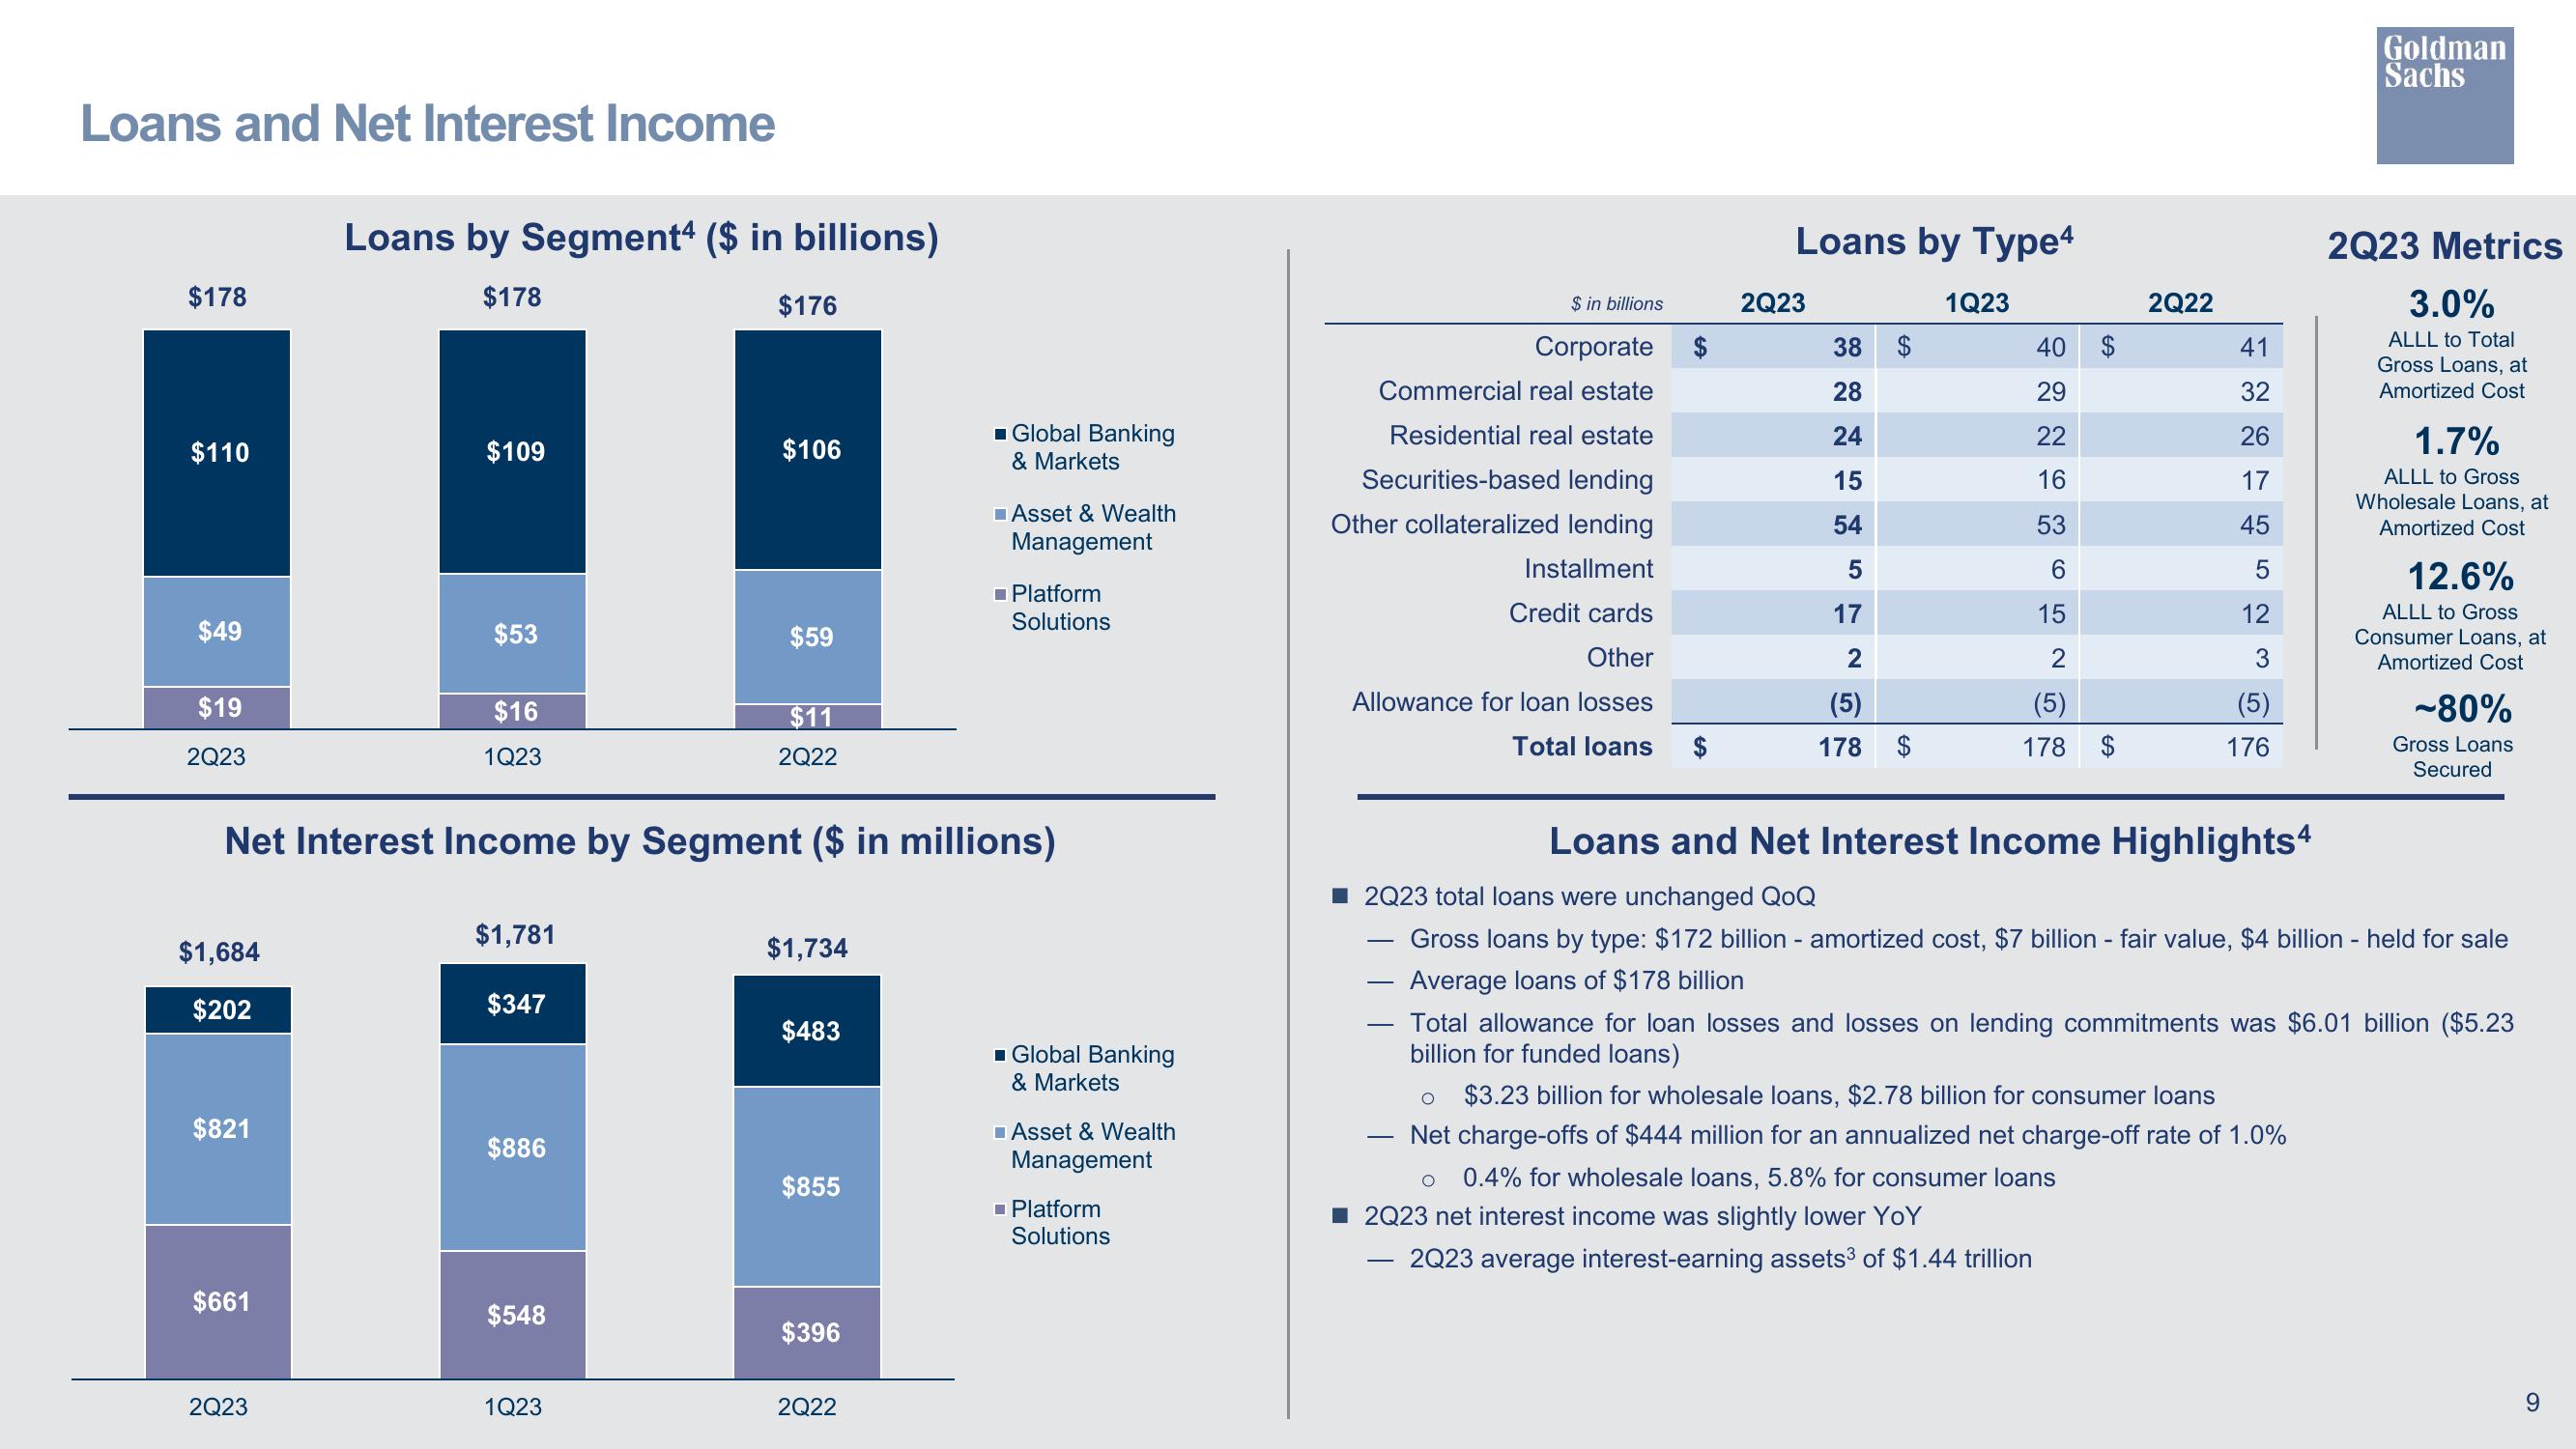
Loans by Segment4 ($ in billions)
$178
2Q23
$109
$53
$16
1Q23
$1,781
$347
Net Interest Income by Segment ($ in millions)
$886
$548
$176
1Q23
$106
$59
$11
2Q22
$1,734
$483
$855
$396
■ Global Banking
& Markets
2Q22
Asset & Wealth
Management
■Platform
Solutions
■ Global Banking
& Markets
Asset & Wealth
Management
■ Platform
Solutions
$ in billions
Corporate
Commercial real estate
Residential real estate
Securities-based lending
Other collateralized lending
Installment
Credit cards
Other
Allowance for loan losses
Total loans
—
Loans by Type4
2Q23
O
38
28
24
15
54
17
2
(5)
178
$
1Q23
40
29
22
16
53
6
15
2
(5)
178
SA
$
2Q22
41
32
26
17
45
5
12
3
(5)
176
Loans and Net Interest Income Highlights4
O $3.23 billion for wholesale loans, $2.78 billion for consumer loans
Net charge-offs of $444 million for an annualized net charge-off rate of 1.0%
0.4% for wholesale loans, 5.8% for consumer loans
■2Q23 net interest income was slightly lower YoY
2Q23 average interest-earning assets³ of $1.44 trillion
Goldman
Sachs
2Q23 Metrics
3.0%
ALLL to Total
Gross Loans, at
Amortized Cost
1.7%
ALLL to Gross
Wholesale Loans, at
Amortized Cost
■2Q23 total loans were unchanged QoQ
Gross loans by type: $172 billion - amortized cost, $7 billion - fair value, $4 billion - held for sale
Average loans of $178 billion
Total allowance for loan losses and losses on lending commitments was $6.01 billion ($5.23
billion for funded loans)
12.6%
ALLL to Gross
Consumer Loans, at
Amortized Cost
-80%
Gross Loans
Secured
9View entire presentation