Phreesia Investor Presentation Deck
$M
Net Loss
Interest expense (income), net
Provision for income taxes
Depreciation and amortization
Stock-based compensation expense
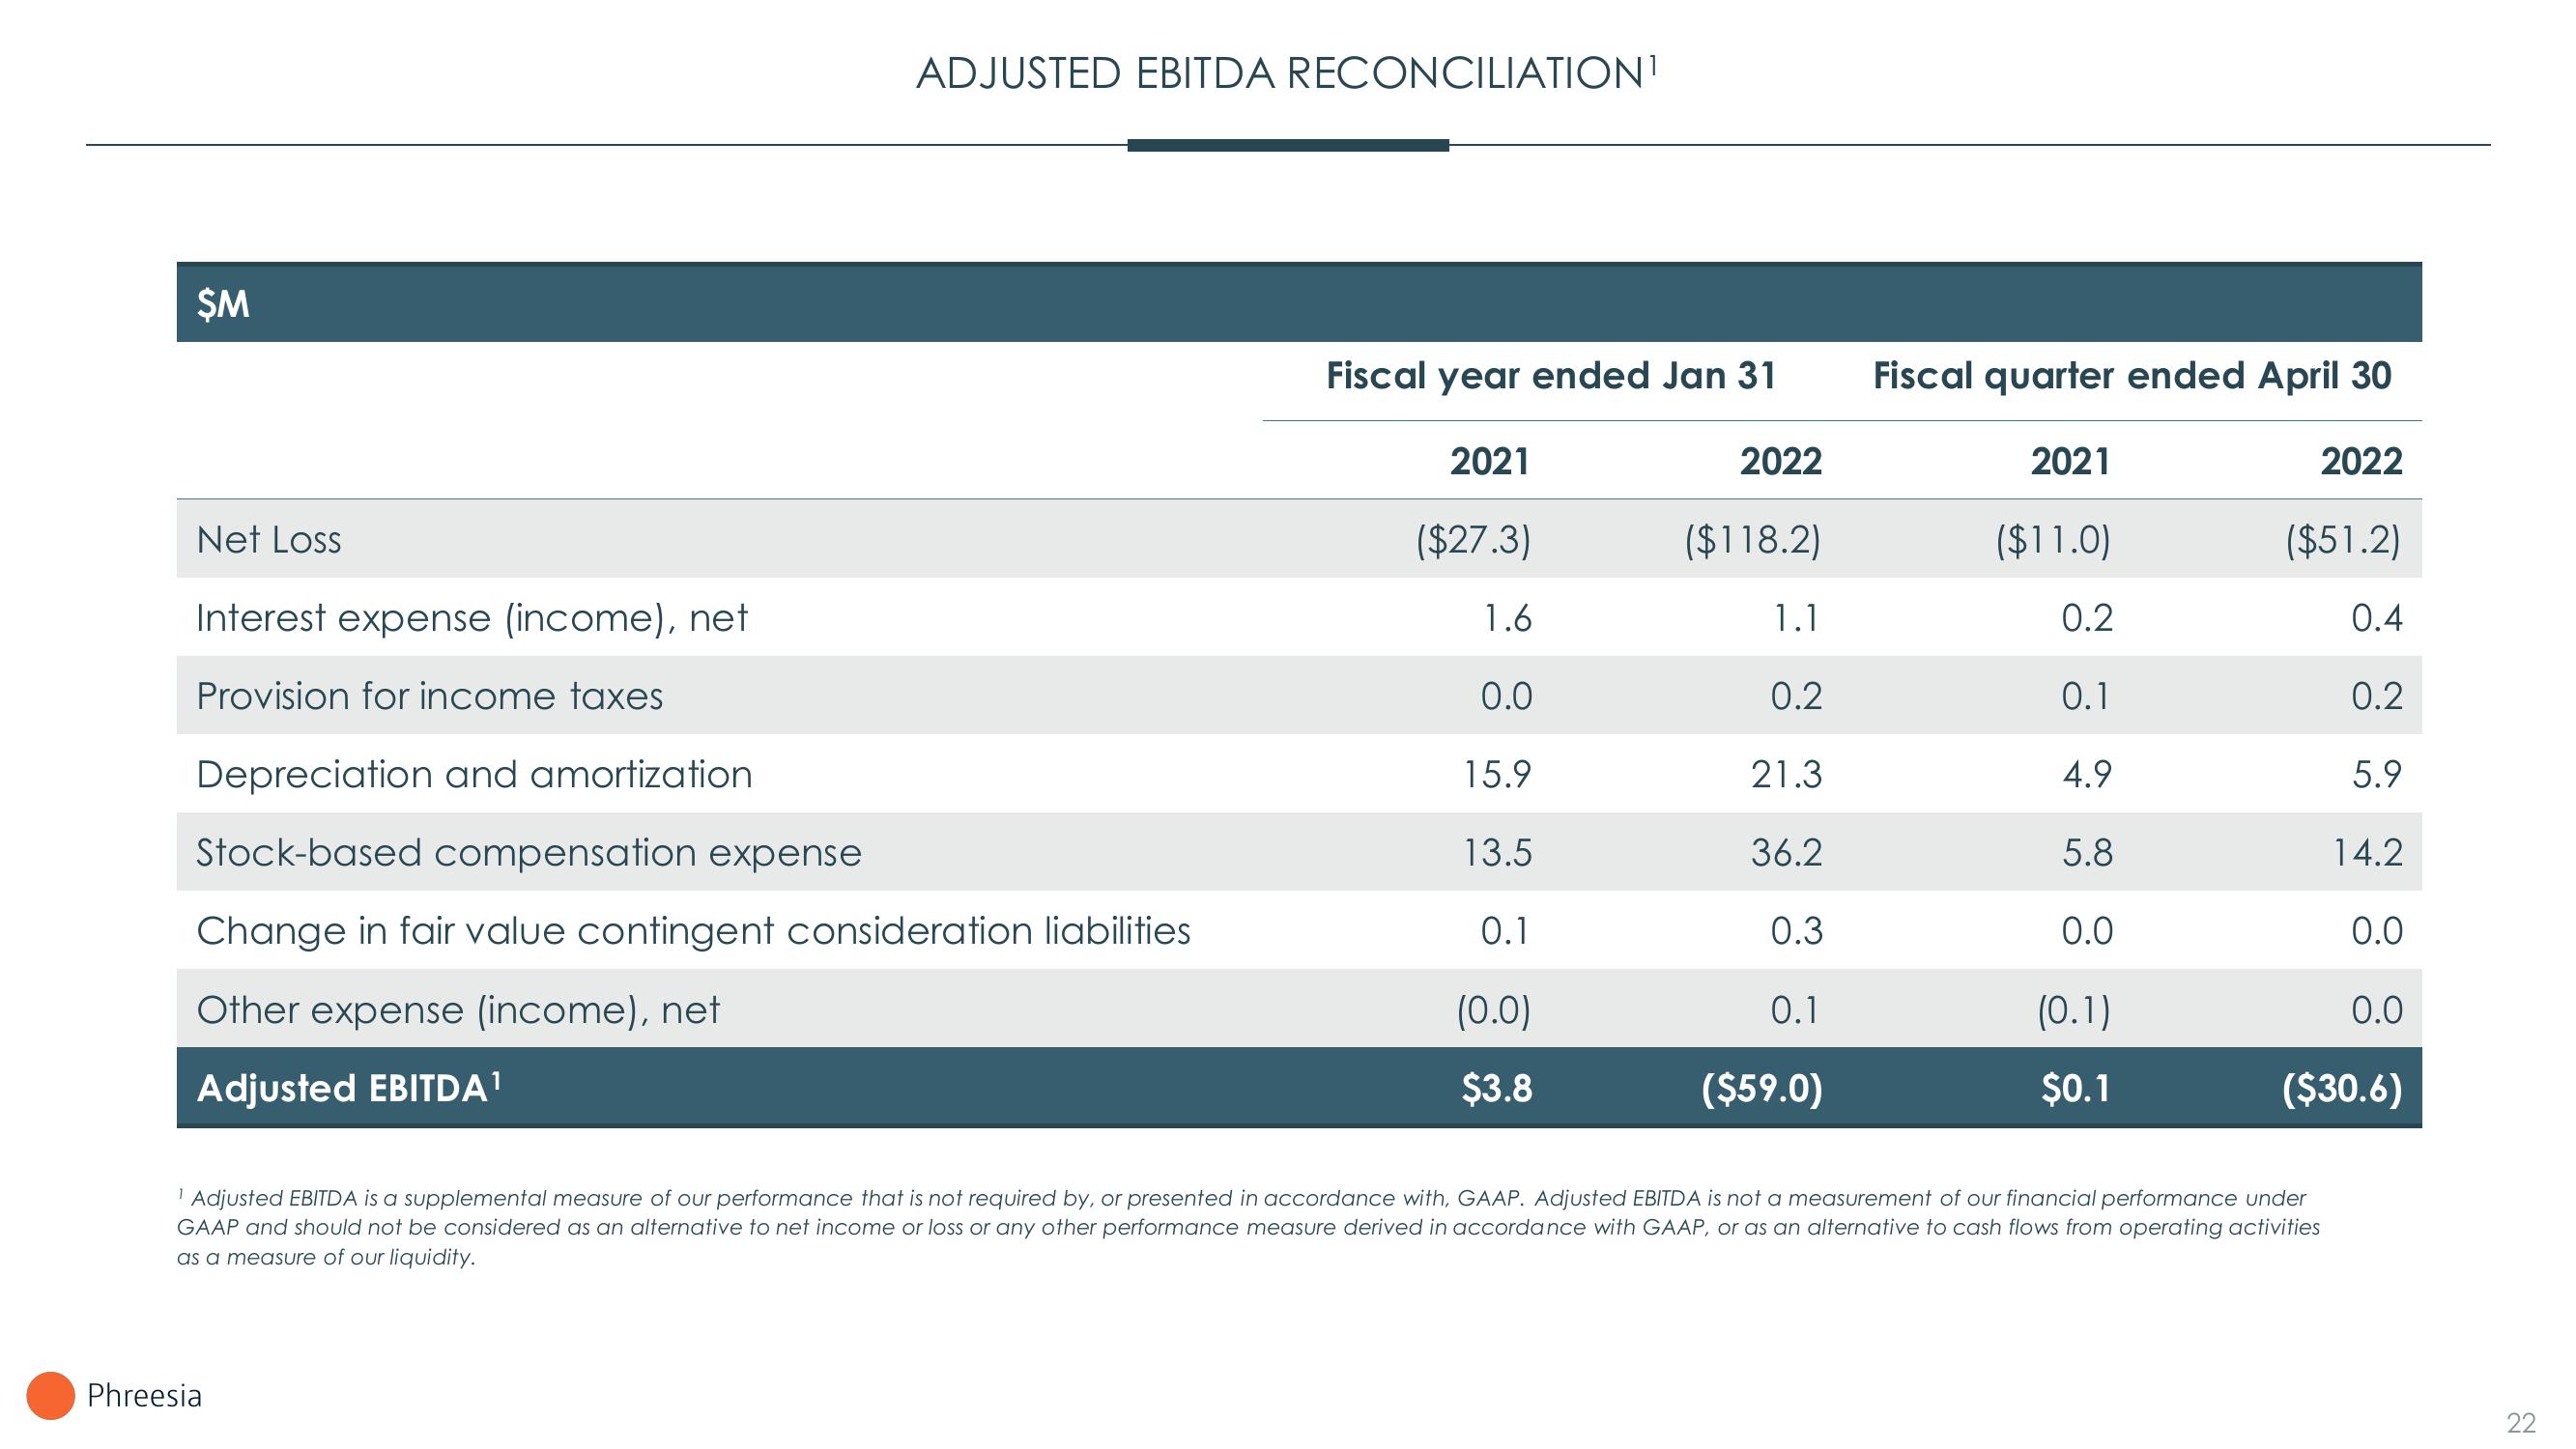
ADJUSTED EBITDA RECONCILIATION¹
Change in fair value contingent consideration liabilities
Other expense (income), net
Adjusted EBITDA¹
Phreesia
Fiscal year ended Jan 31
2021
($27.3)
1.6
0.0
15.9
13.5
0.1
(0.0)
$3.8
2022
($118.2)
1.1
0.2
21.3
36.2
0.3
0.1
($59.0)
Fiscal quarter ended April 30
2021
($11.0)
0.2
0.1
4.9
5.8
0.0
(0.1)
$0.1
2022
($51.2)
0.4
0.2
¹ Adjusted EBITDA is a supplemental measure of our performance that is not required by, or presented in accordance with, GAAP. Adjusted EBITDA is not a measurement of our financial performance under
GAAP and should not be considered as an alternative to net income or loss or any other performance measure derived in accordance with GAAP, or as an alternative to cash flows from operating activities
as a measure of our liquidity.
5.9
14.2
0.0
0.0
($30.6)
22View entire presentation